. 2003 Feb 3;197(3):297-302.
doi: 10.1084/jem.20021343.

G-CSF-stimulated neutrophils are a prominent source of functional BLyS

Affiliations

G-CSF-stimulated neutrophils are a prominent source of functional BLyS

Patrizia Scapini et al. J Exp Med. .

Abstract

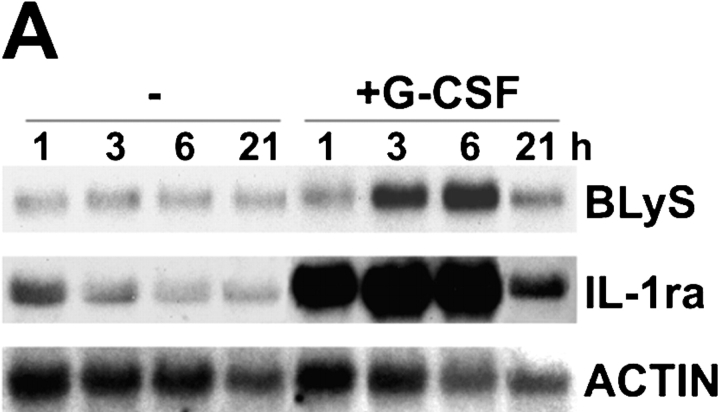
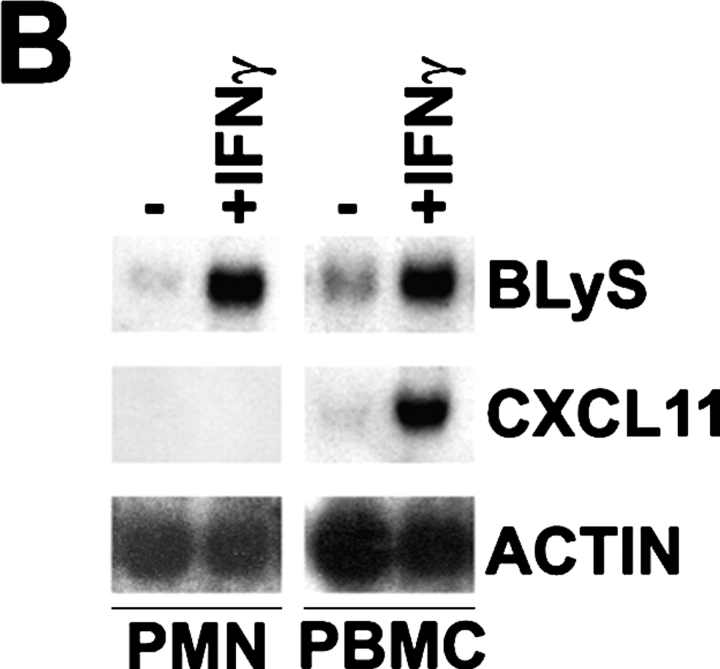
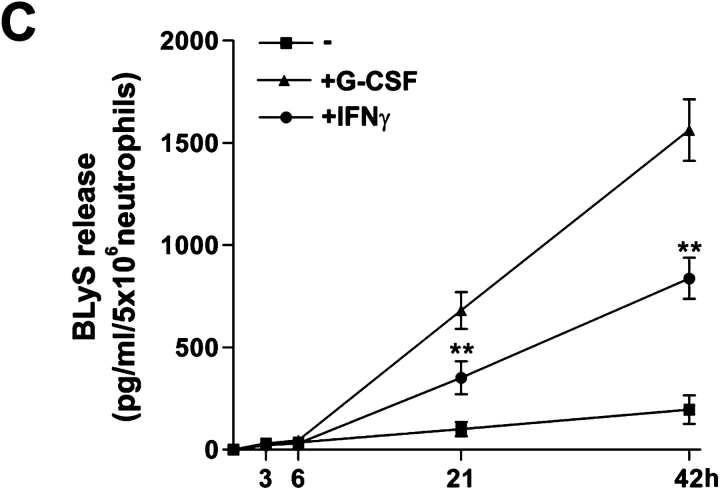
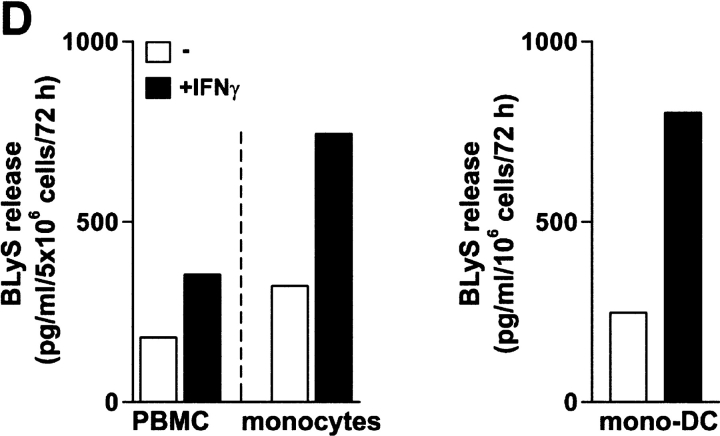
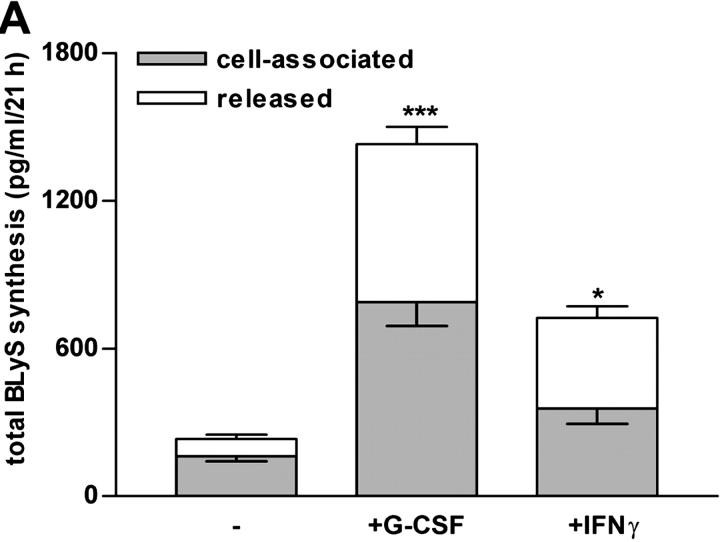
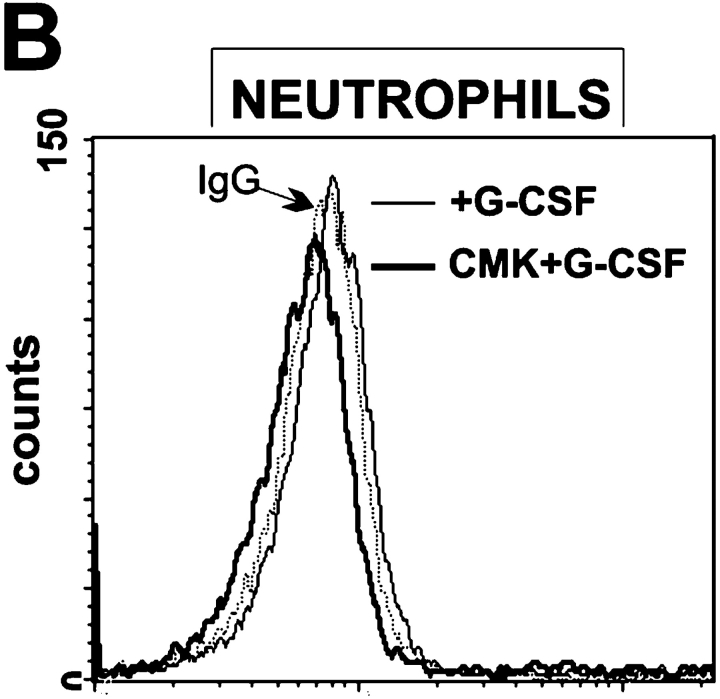
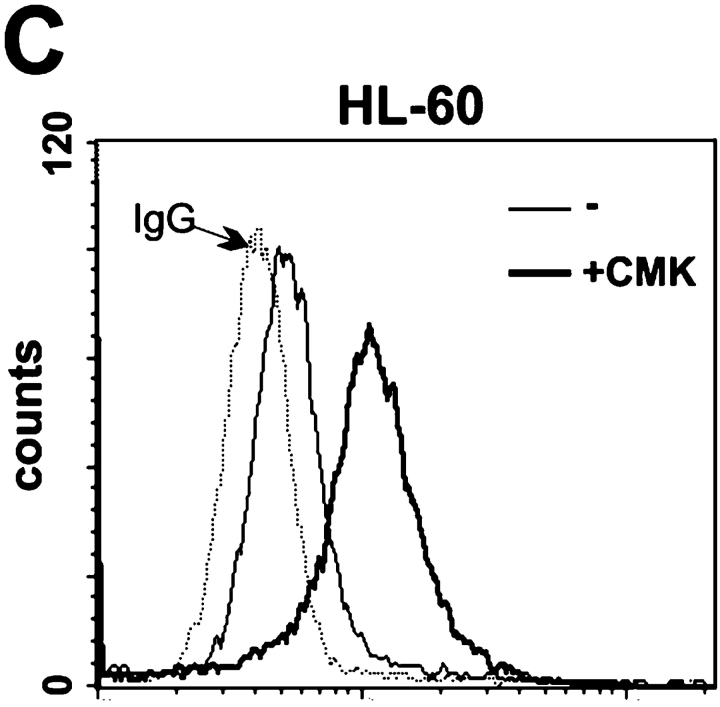
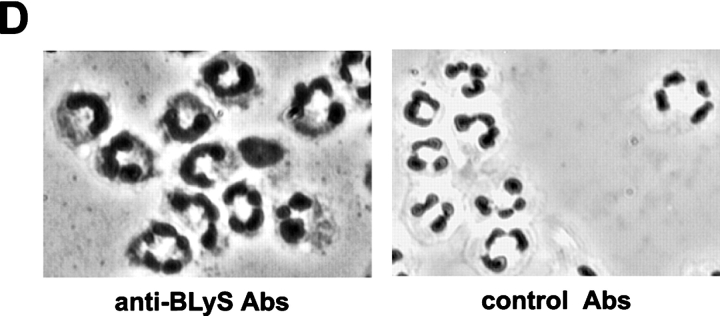
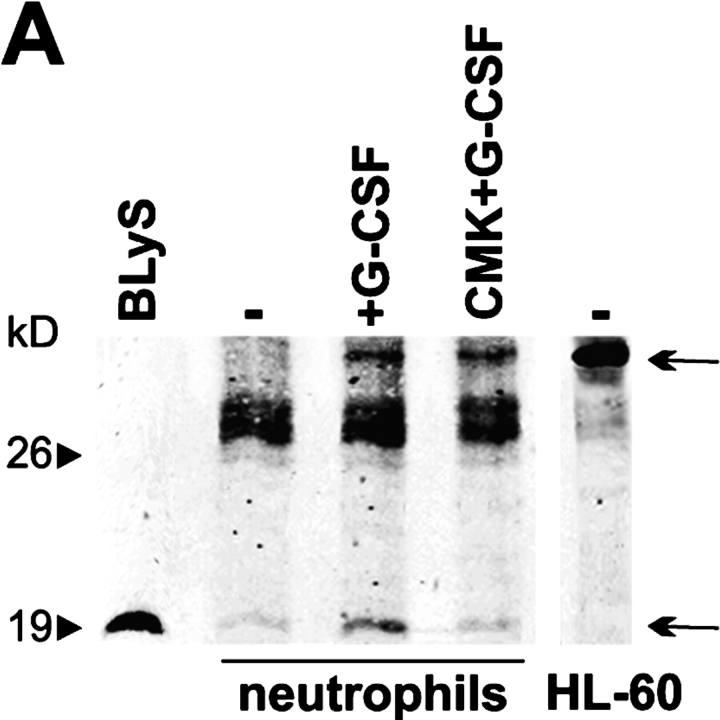
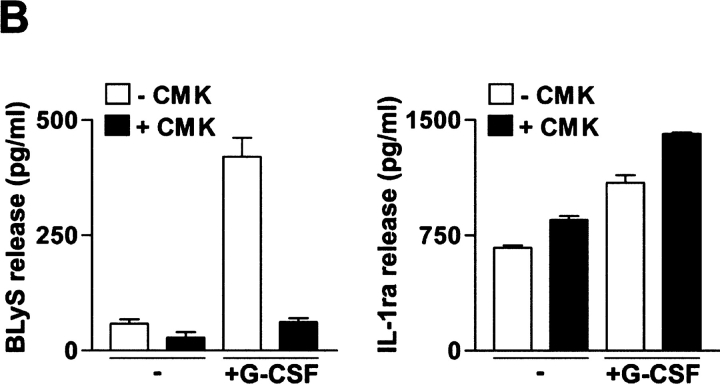
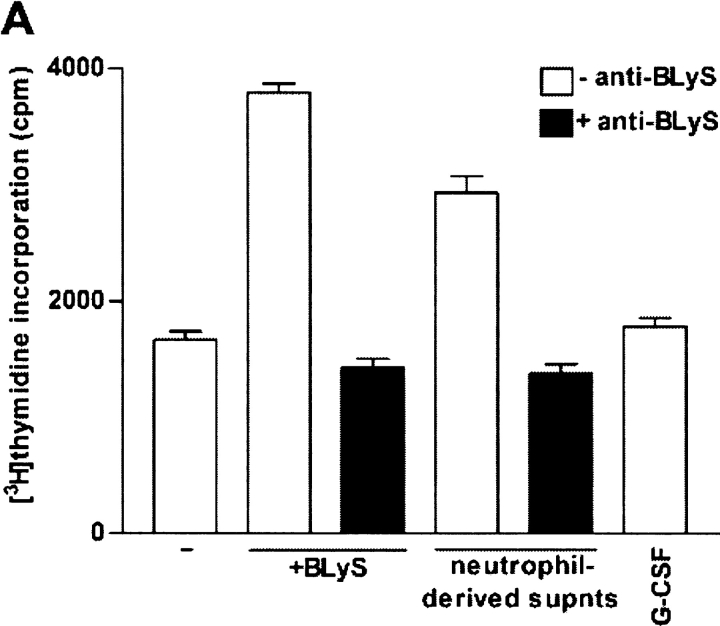
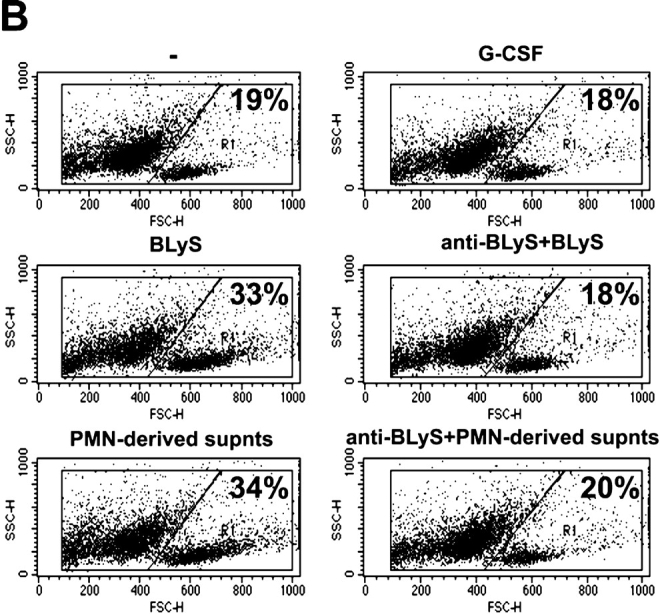
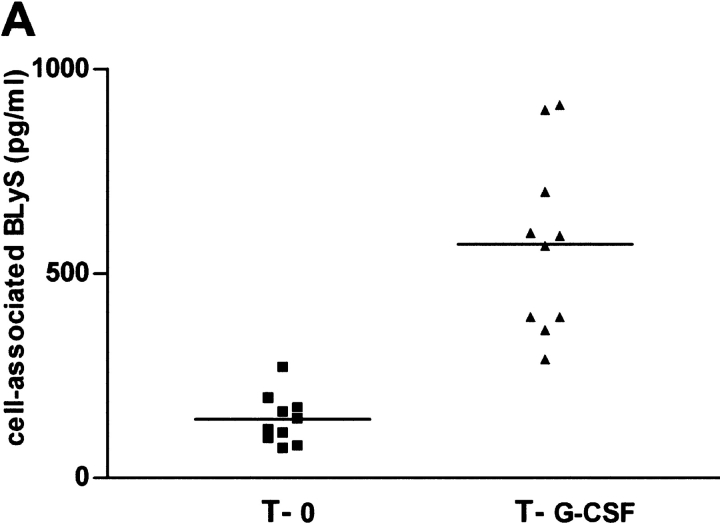
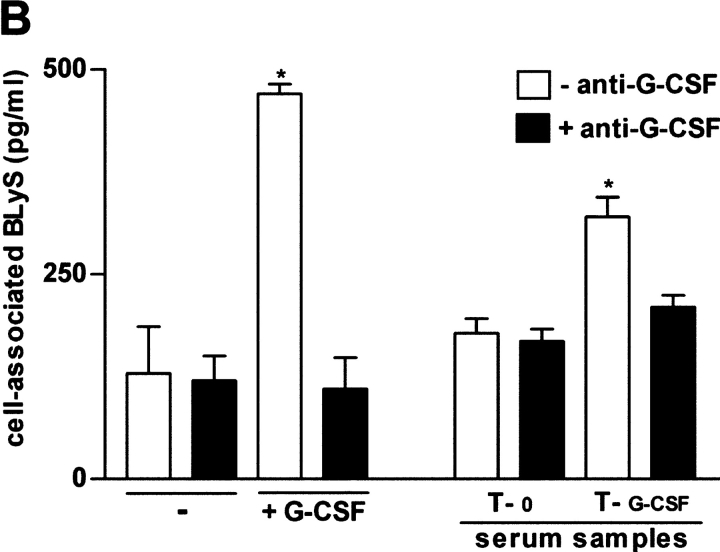
B lymphocyte stimulator (BLyS) is a novel member of the TNF ligand superfamily that is important in B cell maturation and survival. We demonstrate that human neutrophils, after incubation with G-CSF or, less efficiently, IFN gamma, express high levels of BLyS mRNA and release elevated amounts of biologically active BLyS. In contrast, surface expression of the membrane-bound BLyS was not detected in activated neutrophils. Indeed, in neutrophils, uniquely among other myeloid cells, soluble BLyS is processed intracellularly by a furin-type convertase. Worthy of note, the absolute capacity of G-CSF-stimulated neutrophils to release BLyS was similar to that of activated monocytes or dendritic cells, suggesting that neutrophils might represent an important source of BLyS. In this regard, we show that BLyS serum levels as well as neutrophil-associated BLyS are significantly enhanced after in vivo administration of G-CSF in patients. In addition, serum obtained from two of these patients induced a remarkable accumulation of neutrophil-associated BLyS in vitro. This effect was neutralized by anti-G-CSF antibodies, indicating that G-CSF, present in the serum, stimulated neutrophils to produce BLyS. Collectively, our findings suggest that neutrophils, through the production of BLyS, might play an unsuspected role in the regulation of B cell homeostasis.


Figures

Figure 1.
Figure 1.
BLyS mRNA expression and release by activated neutrophils. (A) Purified populations of neutrophils were incubated with 1,000 U/ml G-CSF. At the time points indicated, total RNA was extracted and analyzed for BLyS, IL-1ra, and actin mRNA expression by Northern blotting. (B) Neutrophils and PBMC purified from the same donor were cultured for 21 h with or without 200 U/ml IFNγ, and then were subjected to Northern blot analysis for BLyS, CXCL-11/I-TAC, and actin mRNA expression. Data are representative of results from at least two independent experiments for each panel. (C) Neutrophils were incubated for up to 42 h at 37°C with 1,000 U/ml G-CSF and 200 U/ml IFNγ. Culture supernatants were harvested and processed for BLyS detection by a specific ELISA. Values represent means ± SEM of duplicate determinations calculated from four independent experiments. The asterisks represent significant differences between stimulated and resting neutrophils. **, P < 0.01. (D) PBMC, monocytes, and mono-DC were cultured in the presence or the absence of 200 U/ml IFNγ for 3 d. Culture supernatants were collected, and the levels of BLyS were measured by ELISA. Values represent the means of duplicate determinations calculated from two independent experiments.
Figure 1.
Figure 1.
BLyS mRNA expression and release by activated neutrophils. (A) Purified populations of neutrophils were incubated with 1,000 U/ml G-CSF. At the time points indicated, total RNA was extracted and analyzed for BLyS, IL-1ra, and actin mRNA expression by Northern blotting. (B) Neutrophils and PBMC purified from the same donor were cultured for 21 h with or without 200 U/ml IFNγ, and then were subjected to Northern blot analysis for BLyS, CXCL-11/I-TAC, and actin mRNA expression. Data are representative of results from at least two independent experiments for each panel. (C) Neutrophils were incubated for up to 42 h at 37°C with 1,000 U/ml G-CSF and 200 U/ml IFNγ. Culture supernatants were harvested and processed for BLyS detection by a specific ELISA. Values represent means ± SEM of duplicate determinations calculated from four independent experiments. The asterisks represent significant differences between stimulated and resting neutrophils. **, P < 0.01. (D) PBMC, monocytes, and mono-DC were cultured in the presence or the absence of 200 U/ml IFNγ for 3 d. Culture supernatants were collected, and the levels of BLyS were measured by ELISA. Values represent the means of duplicate determinations calculated from two independent experiments.
Figure 2.
Figure 2.
Lack of membrane-bound BLyS expression in neutrophils. (A) Neutrophils (5 × 10⁶/ml) were incubated for 21 h at 37°C with 1,000 U/ml G-CSF and 200 U/ml IFNγ. Cell-free supernatants and the corresponding pellets were harvested and antigenic BLyS determined in each compartment. The mean values ± SEM of the total production of BLyS (depicted as cell-associated and released) from four independent experiment are shown. Asterisks represent significant differences between stimulated and resting neutrophils. *, P < 0.05; ***, P < 0.001. (B and C) Neutrophils were cultured for 21 h with 1,000 U/ml G-CSF, in the absence or presence of 25 μM CMK. HL-60 cells were cultured for 21 h in the absence or presence of 50 μM CMK. Membrane-bound BLyS expression was examined by FACS® analysis using biotinylated 3D4 mAbs followed by PE-conjugated streptavidin. (D) Immunocytochemical staining of intracellular BLyS performed in cytospin preparations of neutrophils incubated for 21 h with 1,000 U/ml G-CSF. Data are representative of results from at least two independent experiments for each panel.
Figure 2.
Figure 2.
Lack of membrane-bound BLyS expression in neutrophils. (A) Neutrophils (5 × 10⁶/ml) were incubated for 21 h at 37°C with 1,000 U/ml G-CSF and 200 U/ml IFNγ. Cell-free supernatants and the corresponding pellets were harvested and antigenic BLyS determined in each compartment. The mean values ± SEM of the total production of BLyS (depicted as cell-associated and released) from four independent experiment are shown. Asterisks represent significant differences between stimulated and resting neutrophils. *, P < 0.05; ***, P < 0.001. (B and C) Neutrophils were cultured for 21 h with 1,000 U/ml G-CSF, in the absence or presence of 25 μM CMK. HL-60 cells were cultured for 21 h in the absence or presence of 50 μM CMK. Membrane-bound BLyS expression was examined by FACS® analysis using biotinylated 3D4 mAbs followed by PE-conjugated streptavidin. (D) Immunocytochemical staining of intracellular BLyS performed in cytospin preparations of neutrophils incubated for 21 h with 1,000 U/ml G-CSF. Data are representative of results from at least two independent experiments for each panel.
Figure 3.
Figure 3.
BLyS processing takes place at the intracellular level. (A) 1 ng/lane rBLyS and whole-cell extracts prepared from 40 μg unstimulated HL-60 cells, and from 150 μg neutrophils incubated for 21 h with or without 1,000 U/ml G-CSF, in the absence or presence of 25 μM CMK, were electrophoresed, blotted, and analyzed for BLyS protein expression using a specific anti-BLyS polyclonal Abs. The top arrow indicates the nonprocessed 32-kD BLyS, whereas the bottom arrow indicates the cleaved 17-kD BLyS. The experiment shown is representative of three experiments. (B) Neutrophils (5 × 10⁶/ml) were cultured for 21 h with 1,000 U/ml G-CSF, in the absence or presence of 25 μM CMK. Culture supernatants were harvested and examined for BLyS and IL-1ra content. Values represent means ± SEM of duplicate determinations calculated from three independent experiments.
Figure 3.
Figure 3.
BLyS processing takes place at the intracellular level. (A) 1 ng/lane rBLyS and whole-cell extracts prepared from 40 μg unstimulated HL-60 cells, and from 150 μg neutrophils incubated for 21 h with or without 1,000 U/ml G-CSF, in the absence or presence of 25 μM CMK, were electrophoresed, blotted, and analyzed for BLyS protein expression using a specific anti-BLyS polyclonal Abs. The top arrow indicates the nonprocessed 32-kD BLyS, whereas the bottom arrow indicates the cleaved 17-kD BLyS. The experiment shown is representative of three experiments. (B) Neutrophils (5 × 10⁶/ml) were cultured for 21 h with 1,000 U/ml G-CSF, in the absence or presence of 25 μM CMK. Culture supernatants were harvested and examined for BLyS and IL-1ra content. Values represent means ± SEM of duplicate determinations calculated from three independent experiments.
Figure 4.
Figure 4.
Neutrophil-derived supernatants promote B cell proliferation and survival. [3H]Thymidine incorporation by human tonsillar B cells (A) and flow cytometry analysis on FSC/SSC plots of splenocytes from C57BL/6J mice (B) were assessed after a 4- or 3-d culture, respectively, with 5 ng/ml rBLyS or conditioned medium prepared from G-CSF–stimulated neutrophils, in the absence or presence of 0.3 μg/ml of neutralizing anti-BLyS mAbs. 10−5 dilution SAC was added as a costimulus for the proliferation assay. Cell-free culture medium containing G-CSF was used as a control. Values in A are expressed as the mean number ± SEM of triplicate determinations calculated from three independent experiments. The plots in B are representative of three separate experiments.
Figure 4.
Figure 4.
Neutrophil-derived supernatants promote B cell proliferation and survival. [3H]Thymidine incorporation by human tonsillar B cells (A) and flow cytometry analysis on FSC/SSC plots of splenocytes from C57BL/6J mice (B) were assessed after a 4- or 3-d culture, respectively, with 5 ng/ml rBLyS or conditioned medium prepared from G-CSF–stimulated neutrophils, in the absence or presence of 0.3 μg/ml of neutralizing anti-BLyS mAbs. 10−5 dilution SAC was added as a costimulus for the proliferation assay. Cell-free culture medium containing G-CSF was used as a control. Values in A are expressed as the mean number ± SEM of triplicate determinations calculated from three independent experiments. The plots in B are representative of three separate experiments.
Figure 5.
Figure 5.
BLyS production by neutrophils isolated from G-CSF–treated patients. (A) Neutrophils were collected from patients either before G-CSF infusion (T-0) or at day +12 to +14 after treatment (T-G-CSF), lysed, and examined for cell-associated BLyS by ELISA. The plot shows the mean values of averaged duplicate determinations obtained from the number of subjects indicated. (B) Serum samples obtained from two different patients (both at T-0 and T-G-CSF) were preincubated for 2 h at 37°C in the presence or absence of 5 μg/ml neutralizing anti–G-CSF and added to neutrophils isolated from normal donors (at a final 20% vol/vol concentration). As a control, neutrophils were also incubated with 100 U/ml G-CSF (± anti–G-CSF Abs). The mean values ± SEM of BLyS levels associated to neutrophil pellets are shown. The asterisks represent significant differences between stimulated and resting neutrophils. *, P < 0.05 (n = 3).
Figure 5.
Figure 5.
BLyS production by neutrophils isolated from G-CSF–treated patients. (A) Neutrophils were collected from patients either before G-CSF infusion (T-0) or at day +12 to +14 after treatment (T-G-CSF), lysed, and examined for cell-associated BLyS by ELISA. The plot shows the mean values of averaged duplicate determinations obtained from the number of subjects indicated. (B) Serum samples obtained from two different patients (both at T-0 and T-G-CSF) were preincubated for 2 h at 37°C in the presence or absence of 5 μg/ml neutralizing anti–G-CSF and added to neutrophils isolated from normal donors (at a final 20% vol/vol concentration). As a control, neutrophils were also incubated with 100 U/ml G-CSF (± anti–G-CSF Abs). The mean values ± SEM of BLyS levels associated to neutrophil pellets are shown. The asterisks represent significant differences between stimulated and resting neutrophils. *, P < 0.05 (n = 3).

Similar articles

Cited by

References

    1. Moore, P.A., O. Belvedere, A. Orr, K. Pieri, D.W. LaFleur, P. Feng, D. Soppet, M. Charters, R. Gentz, D. Parmelee, et al. 1999. BLyS: member of the tumor necrosis factor family and B lymphocyte stimulator. Science. 285:260–263. - PubMed
    1. Rolink, A.G., and F. Melchers. 2002. BAFFled B cells survive and thrive: roles of BAFF in B-cell development. Curr. Opin. Immunol. 14:266–275. - PubMed
    1. Mackay, F., and J.L. Browning. 2002. BAFF: a fundamental survival factor for B cells. Nat. Rev. Immunol. 2:465–475. - PubMed
    1. Schneider, P., F. MacKay, V. Steiner, K. Hofmann, J.L. Bodmer, N. Holler, C. Ambrose, P. Lawton, S. Bixler, H. Acha-Orbea, et al. 1999. BAFF, a novel ligand of the tumor necrosis factor family, stimulates B cell growth. J. Exp. Med. 189:1747–1756. - PMC - PubMed
    1. Nardelli, B., O. Belvedere, V. Roschke, P.A. Moore, H.S. Olsen, T.S. Migone, S. Sosnovtseva, J.A. Carrell, P. Feng, J.G. Giri, and D.M. Hilbert. 2001. Synthesis and release of B-lymphocyte stimulator from myeloid cells. Blood. 97:198–204. - PubMed

Publication types

MeSH terms