. 2003 Feb 3;197(3):303-14.
doi: 10.1084/jem.20020717.

Regulation of lymphocyte apoptosis by interferon regulatory factor 4 (IRF-4)

Affiliations

Regulation of lymphocyte apoptosis by interferon regulatory factor 4 (IRF-4)

Jessica C Fanzo et al. J Exp Med. .

Abstract

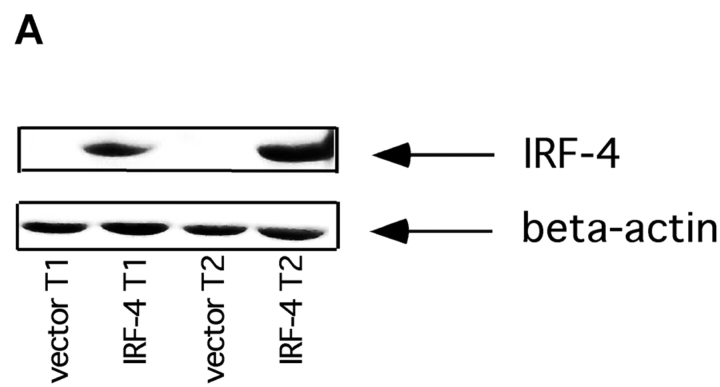
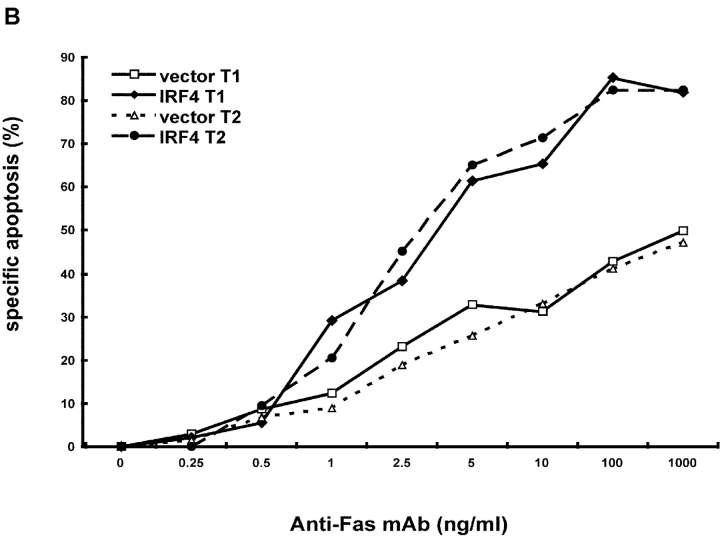
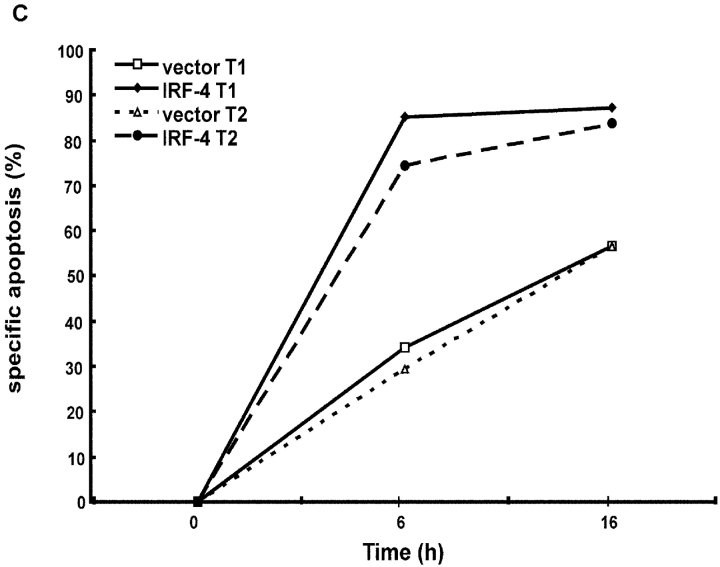
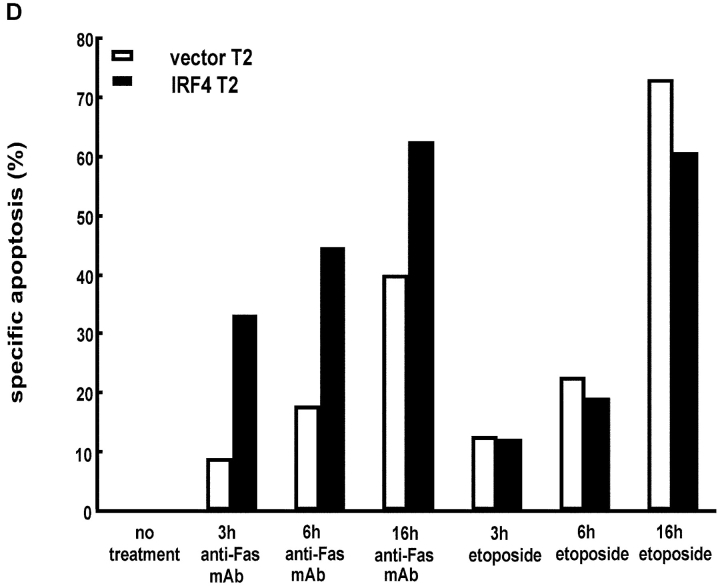
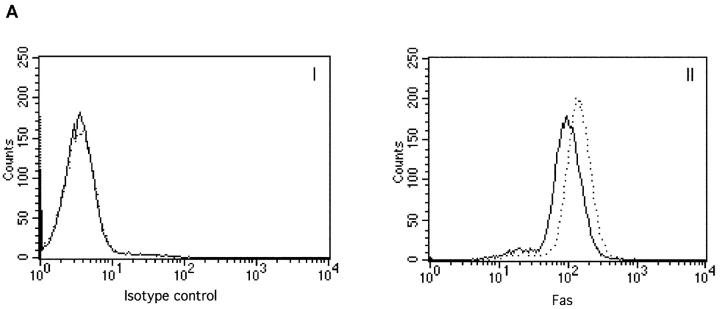
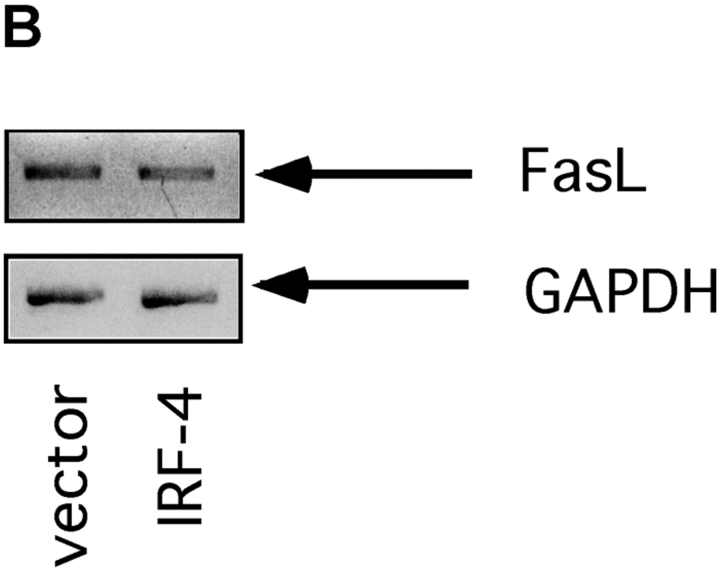
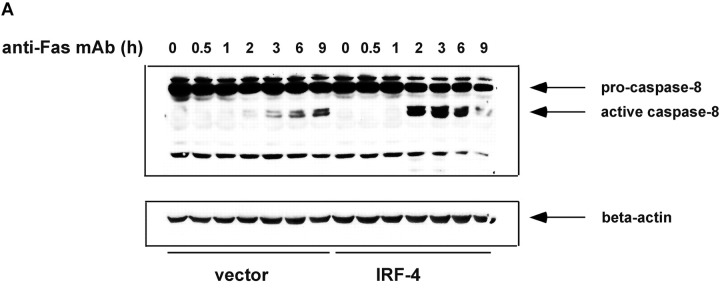
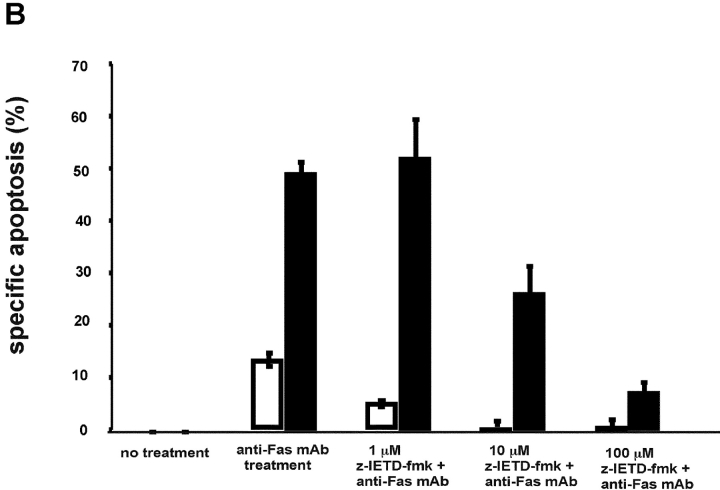
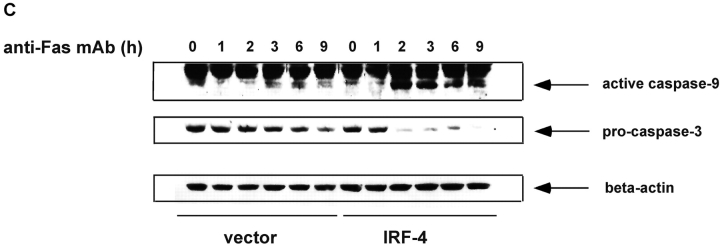
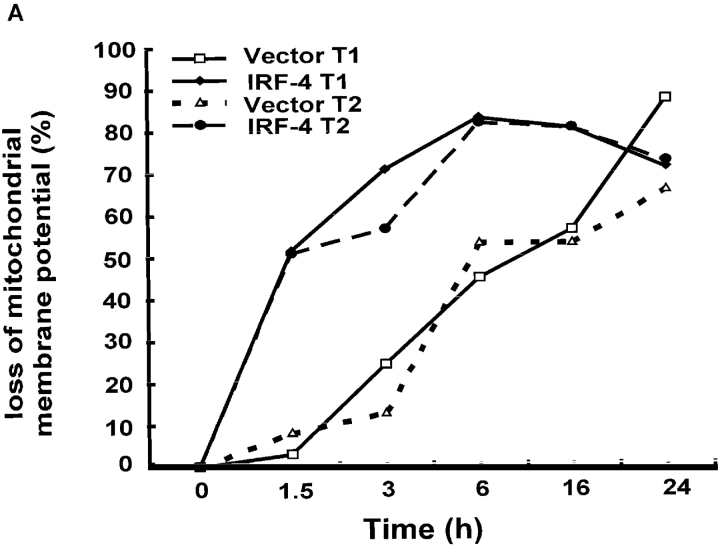
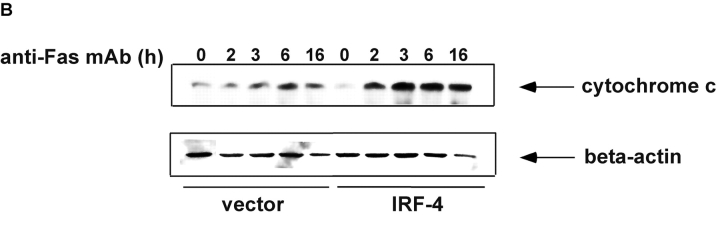
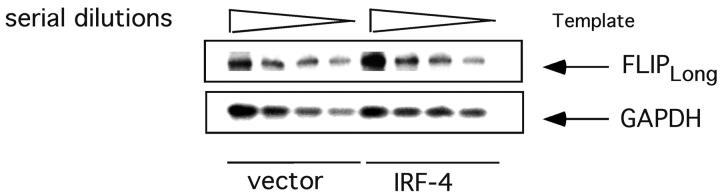
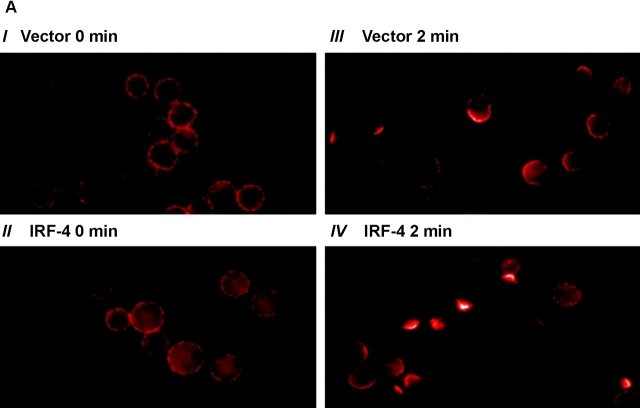
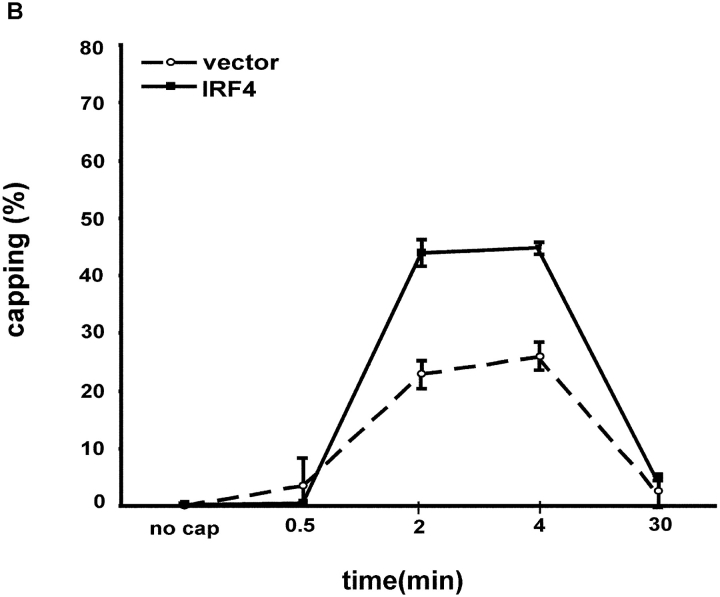
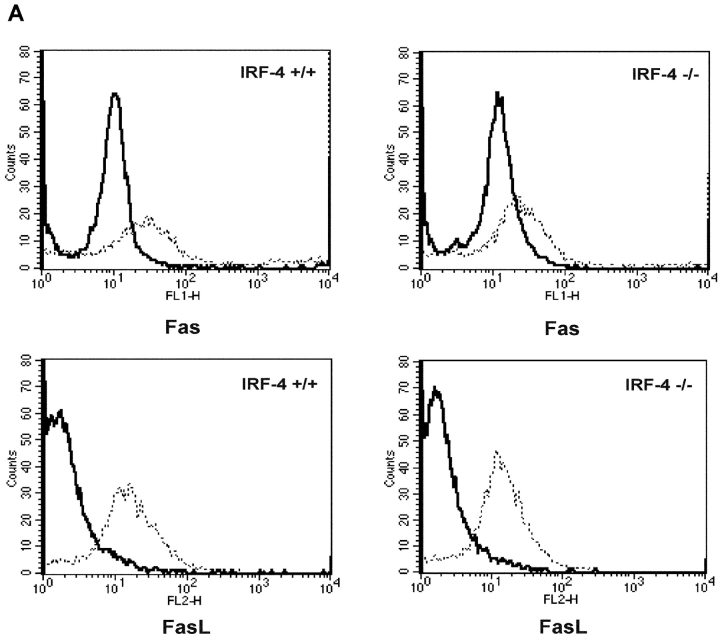
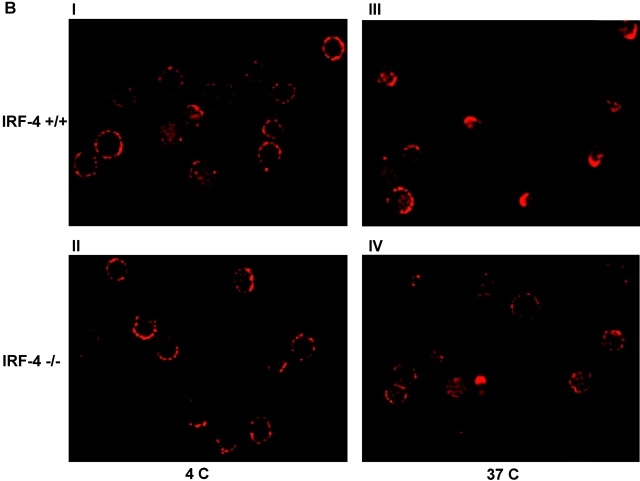
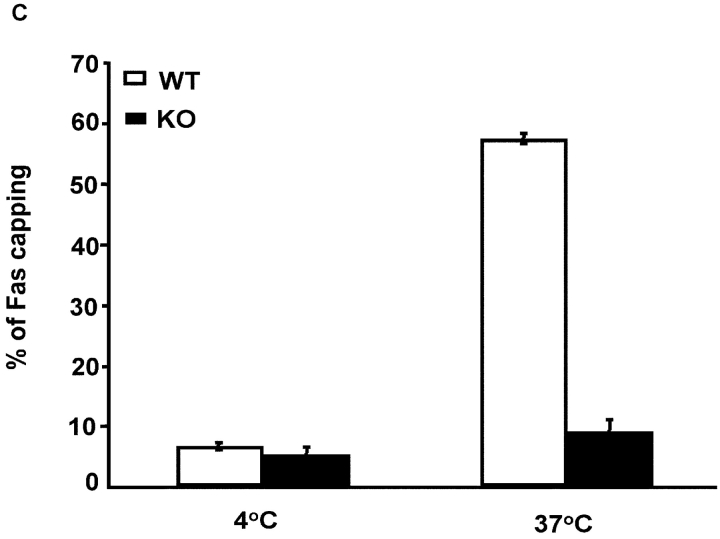
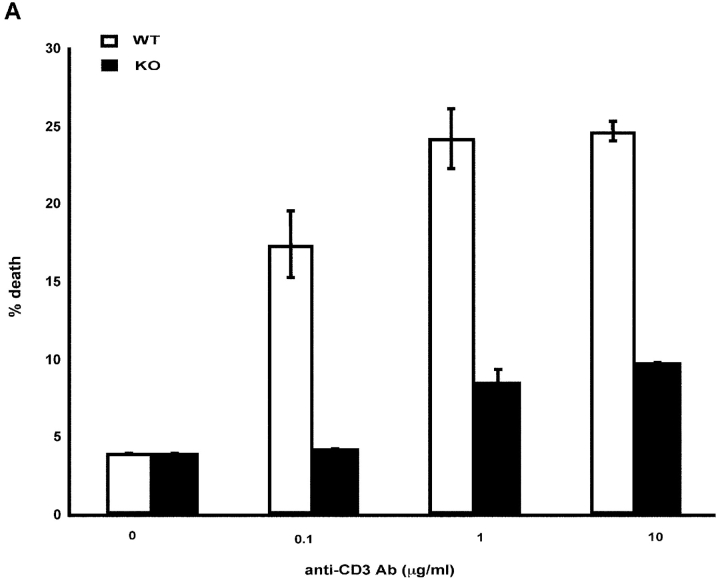
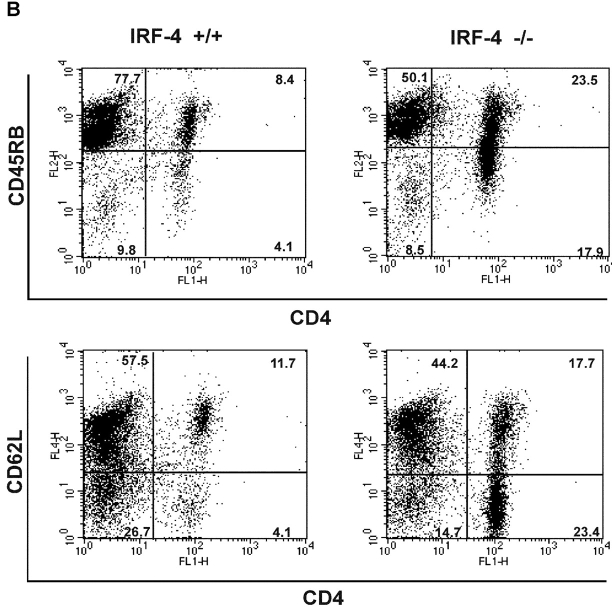
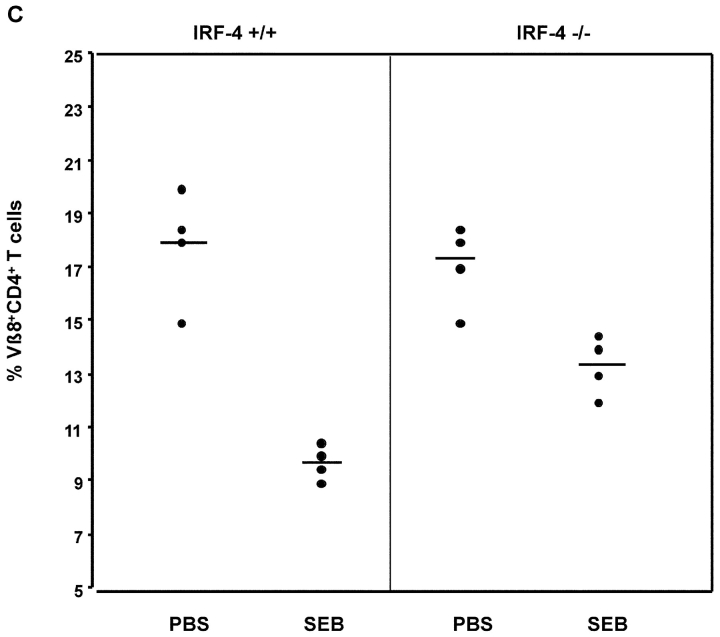
To ensure that homeostasis of the immune system is maintained, the sensitivity of lymphocytes to Fas-mediated apoptosis is differentially regulated during their activation. The molecular mechanisms that link the activation program of lymphocytes to changes in sensitivity to Fas-mediated apoptosis have, however, not been fully characterized. In these studies, we have investigated whether Fas-mediated apoptosis can be regulated by interferon regulatory factor 4 (IRF-4), a lymphoid-restricted member of the IRF family of transcription factors. IRF-4 expression is upregulated during lymphocyte activation and IRF-4-deficient mice have defects in both lymphocyte activation and homeostasis. Here, we show that stable expression of IRF-4 in a human lymphoid cell line that normally lacks IRF-4 leads to a significantly enhanced apoptotic response on Fas receptor engagement. A systematic examination of the downstream effectors of Fas signaling in IRF-4-transfected cells demonstrates an increased activation of caspase-8, as well as an increase in Fas receptor polarization. We demonstrate that IRF-4-deficient mice display defects in activation-induced cell death, as well as superantigen-induced deletion, and that these defects are accompanied by impairments in Fas receptor polarization. These data suggest that IRF-4, by modulating the efficiency of the Fas-mediated death signal, is a novel participant in the regulation of lymphoid cell apoptosis.


Figures

Figure 1.
Figure 1.
Expression of IRF-4 enhances Fas-mediated apoptosis. (A) Western blot analysis of IRF-4 in whole cell lysates of Jurkat cells stably transfected with an either empty vector or an IRF-4 expression vector. The blot was first analyzed using an anti–IRF-4 antibody (top), it was later stripped and reprobed with a β-actin antibody to ensure for equal loading (bottom). (B) Jurkat-transfected cells were incubated for 16 h with the indicated concentrations of an anti-Fas mAb (CH11). After this incubation, cells were harvested and analyzed by flow cytometry for apoptosis by annexin V and AAD staining. (B–D) Data shown are representative of three independent experiments and were performed on two independent sets of transfectants. Transfected Jurkat cells were cultured with 100 ng/ml anti-Fas mAb for 0, 6, or 16 h. Cells were collected at the distinct time points and apoptosis was measured as described in B. The data shown are representative of three independent experiments and were performed on two independent sets of transfectants. Transfected Jurkat cells were cultured with 100 ng/ml anti-Fas mAb or with 10 μg/ml etoposide for 0, 3, 6, or 16 h. After this incubation, cells were harvested and apoptosis was measured as described in B. Data are representative of three independent experiments (open bars). Control Jurkat transfectants; (solid bars) IRF-4 Jurkat transfectants.
Figure 1.
Figure 1.
Expression of IRF-4 enhances Fas-mediated apoptosis. (A) Western blot analysis of IRF-4 in whole cell lysates of Jurkat cells stably transfected with an either empty vector or an IRF-4 expression vector. The blot was first analyzed using an anti–IRF-4 antibody (top), it was later stripped and reprobed with a β-actin antibody to ensure for equal loading (bottom). (B) Jurkat-transfected cells were incubated for 16 h with the indicated concentrations of an anti-Fas mAb (CH11). After this incubation, cells were harvested and analyzed by flow cytometry for apoptosis by annexin V and AAD staining. (B–D) Data shown are representative of three independent experiments and were performed on two independent sets of transfectants. Transfected Jurkat cells were cultured with 100 ng/ml anti-Fas mAb for 0, 6, or 16 h. Cells were collected at the distinct time points and apoptosis was measured as described in B. The data shown are representative of three independent experiments and were performed on two independent sets of transfectants. Transfected Jurkat cells were cultured with 100 ng/ml anti-Fas mAb or with 10 μg/ml etoposide for 0, 3, 6, or 16 h. After this incubation, cells were harvested and apoptosis was measured as described in B. Data are representative of three independent experiments (open bars). Control Jurkat transfectants; (solid bars) IRF-4 Jurkat transfectants.
Figure 2.
Figure 2.
Expression of Fas and FasL in control and IRF-4 transfectants. (A) Surface expression of the Fas receptor in Jurkat transfectants. Cells from control and IRF-4–transfected cells were stained with either a PE-labeled isotype-matched control Ab (I) or a PE-labeled anti-Fas IgG1 antibody (II). Cells were subsequently analyzed by flow cytometry. Control vector transfectants (solid lines); IRF-4 transfectants (dotted lines). (B) RT-PCR analysis for FasL expression in IRF-4 Jurkat transfectants. Total RNA was isolated from control and IRF-4–transfected cells, and RT-PCR was performed using primers specific for FasL (top) or GAPDH (bottom). PCR products were separated by electrophoresis on a 2% agarose gel.
Figure 2.
Figure 2.
Expression of Fas and FasL in control and IRF-4 transfectants. (A) Surface expression of the Fas receptor in Jurkat transfectants. Cells from control and IRF-4–transfected cells were stained with either a PE-labeled isotype-matched control Ab (I) or a PE-labeled anti-Fas IgG1 antibody (II). Cells were subsequently analyzed by flow cytometry. Control vector transfectants (solid lines); IRF-4 transfectants (dotted lines). (B) RT-PCR analysis for FasL expression in IRF-4 Jurkat transfectants. Total RNA was isolated from control and IRF-4–transfected cells, and RT-PCR was performed using primers specific for FasL (top) or GAPDH (bottom). PCR products were separated by electrophoresis on a 2% agarose gel.
Figure 3.
Figure 3.
Stable expression of IRF-4 leads to increased activation of caspase-8 and of downstream caspases upon engagement of the Fas receptor. (A) Cells from control and IRF-4 transfectants were cultured with the anti-Fas mAb CH-11 at 100 ng/ml and harvested after the indicated periods of incubation. Total cell lysates were separated by 7% SDS–polyacrylamide gel electrophoresis, and caspase-8 processing was detected by immunoblotting with an anti–human caspase-8 Ab (top). Vector refers to the control Jurkat transfectants, whereas IRF-4 refers to the IRF-4 stable Jurkat transfectants. The procaspase-8 form at 55 kD and the active caspase-8 at 40 kD are indicated by arrows. Blots were stripped and reprobed with a β-actin Ab as a loading control (bottom). (B) Open bars: control Jurkat transfectants; solid bar: IRF-4 Jurkat transfectants. Vector control and IRF-4 transfectants were cultured with or without z-IETD-fmk, a caspase-8 inhibitor, for 1 h at 37°C at 1-, 10-, or 100-μM concentration followed by the addition of 100 ng/ml anti-Fas mAb for 6 h. After this incubation, cells were harvested and analyzed by flow cytometry for apoptosis as indicated in Fig. 1 B. Addition of z-IETD fmk alone had no effect on the viability of the cells (unpublished data). (C) Cells were incubated with 100 ng/ml anti-Fas mAb CH-11 and harvested after the indicated periods of incubation. Total cell lysates were separated by SDS–polyacrylamide gel electrophoresis, and caspase-9 and -3 processing was detected by immunoblotting with antibodies against either active human caspase-9 (top) or procaspase-3 (middle). The active caspase-9 form at 37 kD and the procaspase-3 form are indicated by arrows. Blots were stripped and reprobed with a β-actin Ab as a loading control (bottom).
Figure 3.
Figure 3.
Stable expression of IRF-4 leads to increased activation of caspase-8 and of downstream caspases upon engagement of the Fas receptor. (A) Cells from control and IRF-4 transfectants were cultured with the anti-Fas mAb CH-11 at 100 ng/ml and harvested after the indicated periods of incubation. Total cell lysates were separated by 7% SDS–polyacrylamide gel electrophoresis, and caspase-8 processing was detected by immunoblotting with an anti–human caspase-8 Ab (top). Vector refers to the control Jurkat transfectants, whereas IRF-4 refers to the IRF-4 stable Jurkat transfectants. The procaspase-8 form at 55 kD and the active caspase-8 at 40 kD are indicated by arrows. Blots were stripped and reprobed with a β-actin Ab as a loading control (bottom). (B) Open bars: control Jurkat transfectants; solid bar: IRF-4 Jurkat transfectants. Vector control and IRF-4 transfectants were cultured with or without z-IETD-fmk, a caspase-8 inhibitor, for 1 h at 37°C at 1-, 10-, or 100-μM concentration followed by the addition of 100 ng/ml anti-Fas mAb for 6 h. After this incubation, cells were harvested and analyzed by flow cytometry for apoptosis as indicated in Fig. 1 B. Addition of z-IETD fmk alone had no effect on the viability of the cells (unpublished data). (C) Cells were incubated with 100 ng/ml anti-Fas mAb CH-11 and harvested after the indicated periods of incubation. Total cell lysates were separated by SDS–polyacrylamide gel electrophoresis, and caspase-9 and -3 processing was detected by immunoblotting with antibodies against either active human caspase-9 (top) or procaspase-3 (middle). The active caspase-9 form at 37 kD and the procaspase-3 form are indicated by arrows. Blots were stripped and reprobed with a β-actin Ab as a loading control (bottom).
Figure 4.
Figure 4.
Mitochondrial dysfunction after engagement of the Fas receptor is enhanced in the presence of IRF-4. (A) Jurkat control and IRF-4–transfected cells were incubated with the anti-Fas mAb at 100 ng/ml for the indicated times. After this incubation, cells were harvested, stained with the MitoTracker X-rhodamine mitochondrion-selective dye, and analyzed by flow cytometry for loss of mitochondrial membrane potential. Cells that lost staining with the mitochondrial-specific dye were considered as cells with loss of mitochondrial membrane potential. (B) Cells were cultured with 100 ng/ml anti-Fas mAb CH-11 and harvested after the indicated periods of incubation. Cytosolic extracts were separated by SDS–polyacrylamide gel electrophoresis and cytochrome c release was detected by immunoblotting with an antibody against human cytochrome c (top). The position of cytochrome c at 15 kD is indicated by arrows. Blots were stripped and reprobed with a β-actin Ab as a loading control (bottom).
Figure 4.
Figure 4.
Mitochondrial dysfunction after engagement of the Fas receptor is enhanced in the presence of IRF-4. (A) Jurkat control and IRF-4–transfected cells were incubated with the anti-Fas mAb at 100 ng/ml for the indicated times. After this incubation, cells were harvested, stained with the MitoTracker X-rhodamine mitochondrion-selective dye, and analyzed by flow cytometry for loss of mitochondrial membrane potential. Cells that lost staining with the mitochondrial-specific dye were considered as cells with loss of mitochondrial membrane potential. (B) Cells were cultured with 100 ng/ml anti-Fas mAb CH-11 and harvested after the indicated periods of incubation. Cytosolic extracts were separated by SDS–polyacrylamide gel electrophoresis and cytochrome c release was detected by immunoblotting with an antibody against human cytochrome c (top). The position of cytochrome c at 15 kD is indicated by arrows. Blots were stripped and reprobed with a β-actin Ab as a loading control (bottom).
Figure 5.
Figure 5.
Expression of IRF-4 does not significantly affect FLIP levels. Total RNA from control and IRF-4 stable transfectants was isolated and reverse transcribed using oligo dT primers. PCR was performed on twofold serial dilutions of the first-strand cDNA using primers specific for FLIPlong or GAPDH. The PCR products were electrophoresed on a 2% agarose gel and transferred to a nylon membrane. The blot was probed with 32P-labeled full-length FLIP cDNA (top) followed by probing with GAPDH cDNA (bottom).
Figure 6.
Figure 6.
Stable expression of IRF-4 in Jurkat cells leads to enhanced polarization of the Fas receptor. (A) 106 Jurkat transfectants were exposed first to 1 μg/ml anti-Fas Ab at 4°C for 60 min, and then to Alexa Fluor® 568–conjugated secondary antibody. Cells were warmed at 37°C for 30 s, 2 min, 4 min, and 30 min, harvested, fixed with 3.7% formaldehyde, and mounted onto slides. Unstimulated control cells (no cap) were exposed to the anti-Fas Ab and the secondary antibody at 4°C only. Cells were examined with a microscope using a Plan-Apochromat 100×/1.4 NA objective lens, and a cooled CCD camera. Photos were taken of no capping samples and of the maximum capping time point of 2 min in both control and IRF-4 transfectants. Panels I and II are no capping controls of vector and IRF-4, respectively. Panels III and IV are representative of control and IRF-4 transfectant cells, respectively, that have undergone Fas capping for 2 min. (B) Quantitation of Fas capping in the distinct Jurkat transfectants. Fas capping was quantitated as described in Materials and Methods. 150–250 cells were analyzed at each time point.
Figure 6.
Figure 6.
Stable expression of IRF-4 in Jurkat cells leads to enhanced polarization of the Fas receptor. (A) 106 Jurkat transfectants were exposed first to 1 μg/ml anti-Fas Ab at 4°C for 60 min, and then to Alexa Fluor® 568–conjugated secondary antibody. Cells were warmed at 37°C for 30 s, 2 min, 4 min, and 30 min, harvested, fixed with 3.7% formaldehyde, and mounted onto slides. Unstimulated control cells (no cap) were exposed to the anti-Fas Ab and the secondary antibody at 4°C only. Cells were examined with a microscope using a Plan-Apochromat 100×/1.4 NA objective lens, and a cooled CCD camera. Photos were taken of no capping samples and of the maximum capping time point of 2 min in both control and IRF-4 transfectants. Panels I and II are no capping controls of vector and IRF-4, respectively. Panels III and IV are representative of control and IRF-4 transfectant cells, respectively, that have undergone Fas capping for 2 min. (B) Quantitation of Fas capping in the distinct Jurkat transfectants. Fas capping was quantitated as described in Materials and Methods. 150–250 cells were analyzed at each time point.
Figure 7.
Figure 7.
CD4+ T cells from IRF-4–deficient mice exhibit normal Fas and FasL expression but reduced polarization of the Fas receptor. (A) FACS® analysis of Fas and FasL expression in purified CD4+ T cells from wild-type (IRF-4 +/+) or IRF-4–deficient (IRF-4 −/−) mice, which were either left unstimulated (solid lines) or stimulated with 1 μg/ml anti-CD3 and 1 μg/ml anti-CD28 Abs plus 10 ng/ml IL-2 for 3 d (dotted lines). No differences were noted by staining with isotype-matched controls performed in parallel samples (unpublished data). (B) I and II are no capping controls of control and IRF-4–deficient T cells, respectively. III and IV are representative of control and IRF-4–deficient T cells, respectively, that have undergone Fas capping for 3 min. Fas capping. After activation, 106 purified naive CD4+ T cells were exposed first to 20 μg/ml anti-Fas at 4°C for 60 min, and then to Alexa Fluor® 568–conjugated secondary antibody. Cells were warmed at 37°C for 3 min, harvested, fixed with 3.7% formaldehyde, and mounted onto slides. No capping control cells were exposed to anti-Fas and secondary antibody at 4°C only. Cells were examined using a laser scanning confocal microscope with a 100×/1.3 Plan-Neofluor objective lens. Optical section thickness was ∼1 μm. Representative images were taken of no capping samples and of the maximum capping time point of 3 min. Capped T cells are indicated by arrows, whereas partially capped or patched T cells are indicated by asterisks. (C) Quantitation of Fas capping. Cells were stimulated as described in B. Fas capping was quantified using a fluorescent microscope as described in Fig. 6 B. Cells were considered to have Fas caps if the staining pattern showed polarization that condensed to <25% of the cell surface. The experiment is representative of three separate experiments, which were conducted on 5–8-wk-old mice. Isotype-matched controls were also performed and were comparable to control no capped staining (unpublished data).
Figure 7.
Figure 7.
CD4+ T cells from IRF-4–deficient mice exhibit normal Fas and FasL expression but reduced polarization of the Fas receptor. (A) FACS® analysis of Fas and FasL expression in purified CD4+ T cells from wild-type (IRF-4 +/+) or IRF-4–deficient (IRF-4 −/−) mice, which were either left unstimulated (solid lines) or stimulated with 1 μg/ml anti-CD3 and 1 μg/ml anti-CD28 Abs plus 10 ng/ml IL-2 for 3 d (dotted lines). No differences were noted by staining with isotype-matched controls performed in parallel samples (unpublished data). (B) I and II are no capping controls of control and IRF-4–deficient T cells, respectively. III and IV are representative of control and IRF-4–deficient T cells, respectively, that have undergone Fas capping for 3 min. Fas capping. After activation, 106 purified naive CD4+ T cells were exposed first to 20 μg/ml anti-Fas at 4°C for 60 min, and then to Alexa Fluor® 568–conjugated secondary antibody. Cells were warmed at 37°C for 3 min, harvested, fixed with 3.7% formaldehyde, and mounted onto slides. No capping control cells were exposed to anti-Fas and secondary antibody at 4°C only. Cells were examined using a laser scanning confocal microscope with a 100×/1.3 Plan-Neofluor objective lens. Optical section thickness was ∼1 μm. Representative images were taken of no capping samples and of the maximum capping time point of 3 min. Capped T cells are indicated by arrows, whereas partially capped or patched T cells are indicated by asterisks. (C) Quantitation of Fas capping. Cells were stimulated as described in B. Fas capping was quantified using a fluorescent microscope as described in Fig. 6 B. Cells were considered to have Fas caps if the staining pattern showed polarization that condensed to <25% of the cell surface. The experiment is representative of three separate experiments, which were conducted on 5–8-wk-old mice. Isotype-matched controls were also performed and were comparable to control no capped staining (unpublished data).
Figure 8.
Figure 8.
IRF-4–deficient mice exhibit impaired AICD and an accumulation of CD4+ T cells with an “experienced” phenotype upon aging. (A) AICD. Purified naive CD4+ T cells were activated with 1 μg/ml anti-CD3 plus IL-2 for 3 d, and then harvested. The cells were restimulated with either IL-2 alone or IL-2 + anti-CD3 at the indicated doses for 24 h. The percentage of apoptotic cells was determined by quantification of the sub-G0 population by FACS®. Each assay was conducted in duplicate. The experiment is representative of three separate experiments. (B) Flow cytometric analysis of spleen cells from 12–15-wk-old wild-type and IRF-4–deficient mice. Single cell suspensions of splenocytes were stained with anti-CD4 versus anti-CD45RB (top) or anti-CD4 versus CD62L (bottom). Percentages of positive cells within each quadrant are indicated. (C) Mice (four per treatment) were injected with either PBS or SEB. After 10 d, the percentage of Vβ8+CD4+ (SEB responsive) T cells in lymph nodes was determined by flow cytometry. Each symbol represents an individual mouse. Bars represent the mean of each group of four mice. The number of Vβ6+CD4+ (SEB unresponsive) T cells was also determined by flow cytometry as a control, and it was found not to be affected by SEB treatment in either wild-type or IRF-4–deficient mice (unpublished data).
Figure 8.
Figure 8.
IRF-4–deficient mice exhibit impaired AICD and an accumulation of CD4+ T cells with an “experienced” phenotype upon aging. (A) AICD. Purified naive CD4+ T cells were activated with 1 μg/ml anti-CD3 plus IL-2 for 3 d, and then harvested. The cells were restimulated with either IL-2 alone or IL-2 + anti-CD3 at the indicated doses for 24 h. The percentage of apoptotic cells was determined by quantification of the sub-G0 population by FACS®. Each assay was conducted in duplicate. The experiment is representative of three separate experiments. (B) Flow cytometric analysis of spleen cells from 12–15-wk-old wild-type and IRF-4–deficient mice. Single cell suspensions of splenocytes were stained with anti-CD4 versus anti-CD45RB (top) or anti-CD4 versus CD62L (bottom). Percentages of positive cells within each quadrant are indicated. (C) Mice (four per treatment) were injected with either PBS or SEB. After 10 d, the percentage of Vβ8+CD4+ (SEB responsive) T cells in lymph nodes was determined by flow cytometry. Each symbol represents an individual mouse. Bars represent the mean of each group of four mice. The number of Vβ6+CD4+ (SEB unresponsive) T cells was also determined by flow cytometry as a control, and it was found not to be affected by SEB treatment in either wild-type or IRF-4–deficient mice (unpublished data).

References

    1. Thome, M., and J. Tschopp. 2001. Regulation of lymphocyte proliferation and death by FLIP. Nat. Rev. Immunol. 1:50–58. - PubMed
    1. Nagata, S., and P. Golstein. 1995. The Fas death factor. Science. 267:1449–1456. - PubMed
    1. Schulze-Osthoff, K., D. Ferrari, M. Los, S. Wesselborg, and M.E. Peter. 1998. Apoptosis signaling by death receptors. Eur. J. Biochem. 254:439–459. - PubMed
    1. Golstein, P. 2000. Signal transduction. FasL binds preassembled Fas. Science. 288:2328–2329. - PubMed
    1. Muzio, M., A.M. Chinnaiyan, F.C. Kischkel, K. O'Rourke, A. Shevchenko, J. Ni, C. Scaffidi, J.D. Bretz, M. Zhang, R. Gentz, et al. 1996. FLICE, a novel FADD-homologous ICE/CED-3-like protease, is recruited to the CD95 (Fas/APO-1) death-inducing signaling complex. Cell. 85:817–827. - PubMed

Publication types

MeSH terms