

doi: 10.1084/jem.20021829.
The major histocompatibility complex-related Fc receptor for IgG (FcRn) binds albumin and prolongs its lifespan
Affiliations
- PMID: 12566415
- PMCID: PMC2193842
- DOI: 10.1084/jem.20021829
Item in Clipboard
The major histocompatibility complex-related Fc receptor for IgG (FcRn) binds albumin and prolongs its lifespan
J Exp Med.
.
Abstract
The inverse relationship between serum albumin concentration and its half-life suggested to early workers that albumin would be protected from a catabolic fate by a receptor-mediated mechanism much like that proposed for IgG. We show here that albumin binds FcRn in a pH dependent fashion, that the lifespan of albumin is shortened in FcRn-deficient mice, and that the plasma albumin concentration of FcRn-deficient mice is less than half that of wild-type mice. These results affirm the hypothesis that the major histocompatibility complex-related Fc receptor protects albumin from degradation just as it does IgG, prolonging the half-lives of both.
Figures
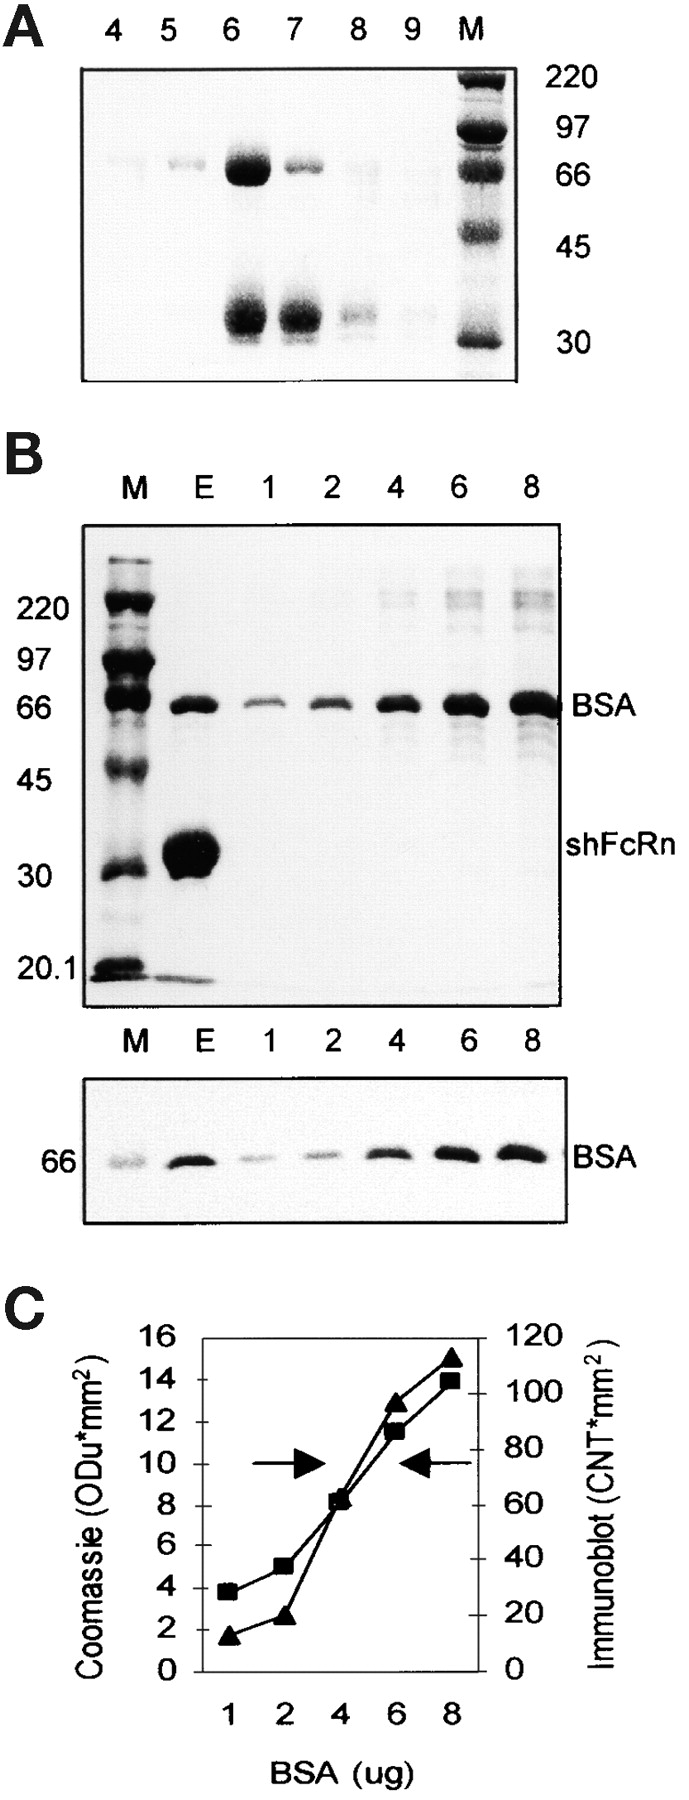
Copurification of BSA and shFcRn by affinity chromatography on Sepharose-hIgG. (A) Culture supernatant from CHO cells secreting recombinant shFcRn was acidified to pH 5.8 and applied to a Sepharose-hIgG chromatography column. Bound shFcRn was eluted at pH 8.1. Six fractions of the elution peak (–9) were analyzed by SDS-PAGE under reducing conditions and Coomassie blue staining. The molecular weight markers (M, in kD) allow identification of the α-chain of shFcRn at ∼35kD and another copurifying protein at 67kD. (B) The elution peak (E) from a Sepharose IgG column was analyzed by SDS-PAGE on two identical gels along with molecular weight standards (M) and graded amounts (lanes 1–8; in μg per lane) of BSA. One gel (top) was stained with Coomassie blue and the other (bottom) was immunoblotted with anti-BSA antibody. (C) The band densities in the Coomassie stained gel (▪) and the immunoblot (▴) of B were plotted (on y-axis) against BSA quantity (on x-axis). The left arrow indicates the eluate density on the Coomassie stained gel while the right arrow indicates the density of the eluate on the immunoblot. Three separate experiments have given equivalent results.
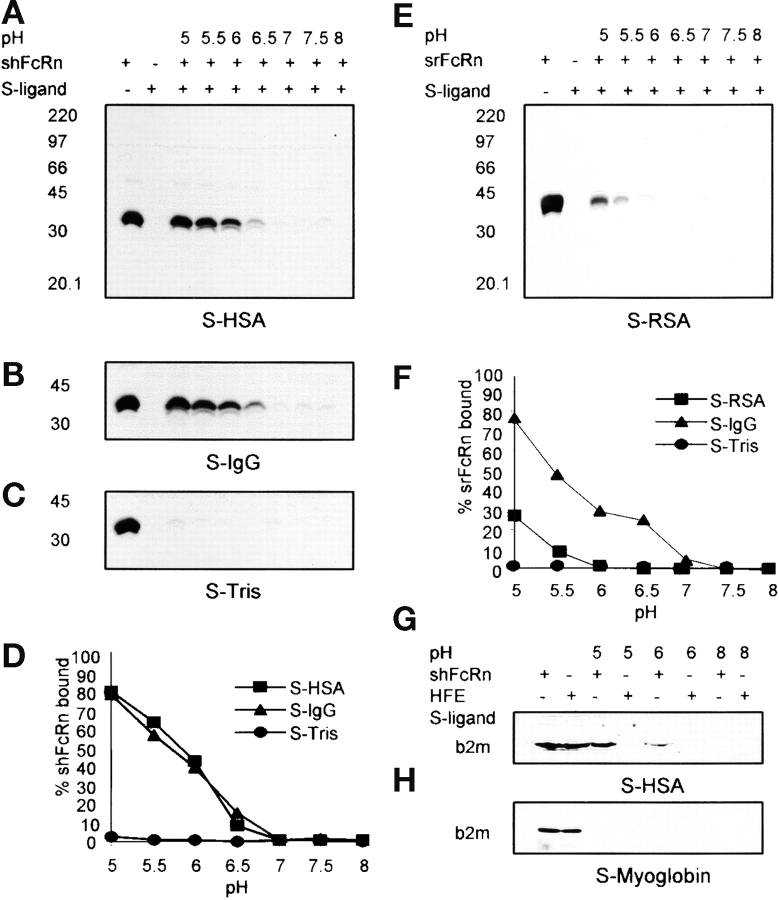
pH-dependent binding of FcRn to immobilized albumin. Sepharose (S)-HSA, S-IgG, S-Tris, S-fish gelatin (see Materials and Methods), or S-RSA were incubated with shFcRn or srFcRn at varying pH as shown. Bound soluble FcRn were eluted and were quantified by immunoblotting with anti-FcRn antibody. Immunoblots of binding of shFcRn to S-HSA, S-IgG, and S-Tris at pH values indicated are shown in A, B, and C, respectively. Immunoblot of binding of srFcRn to S-RSA is shown in E. The positions of molecular weight markers (M, in kD) are shown. Lane 1 in all the gels contained 15 μg soluble FcRn, the amount added to every adsorbent sample. Lane 2 in each case shows the eluate from Sepharose-ligand in the absence of FcRn. The shFcRn bands were quantified and are plotted in panel D vs. pH. Three distinct experiments have given equivalent results. srFcRn band densities are plotted in panel F vs. pH. A second experiment with srFcRn gave equivalent results. G and H show binding of HFE to S-HSA and S-myoglobin. Lanes 1 and 2 show amounts of shFcRn and HFE added (15 μg) to adsorbent samples. Bound protein was eluted and quantified by blotting with anti-b2m antibody.
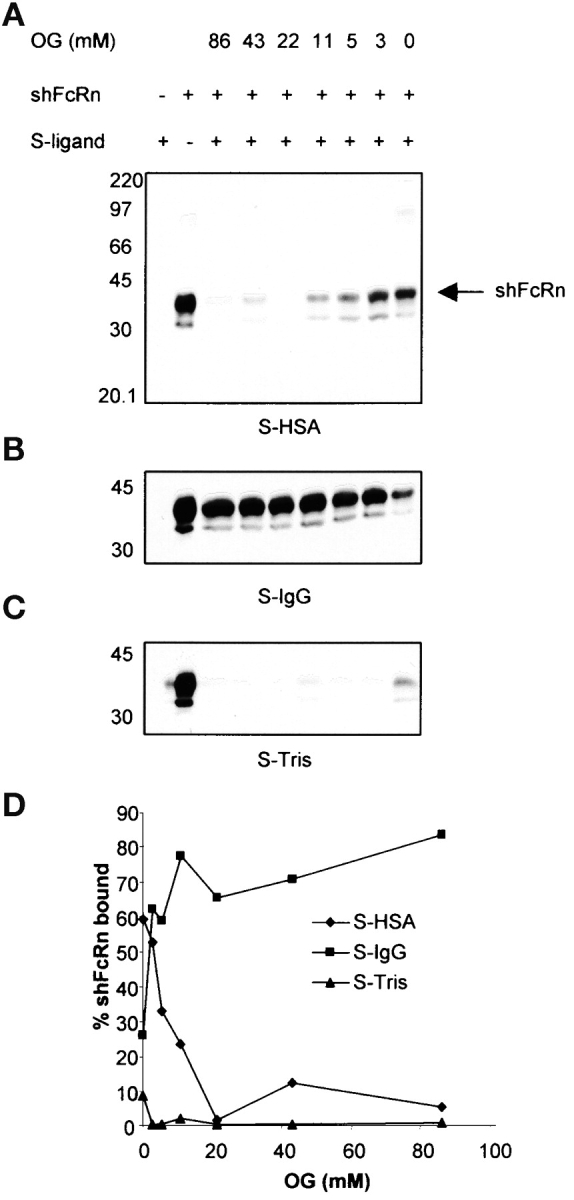
Detergent inhibits shFcRn albumin interaction. Sepharose (S)-HSA, S-IgG and S-Tris (A–C) were incubated with shFcRn in a pH 6.0 buffer containing indicated concentrations of OG as shown. Bound shFcRn was eluted and quantified by immunoblotting with anti-FcRn antibody. The positions of molecular weight markers (M, in kD) are shown. Lane 1 in each case shows the eluate from Sepharose-ligand in the absence of shFcRn. Lane 2 in all the gels contained 10 μg shFcRn, the amount added to every adsorbent sample. The shFcRn bands were quantified and plotted in panel D vs. OG concentration. Similar results were obtained in another experiment.
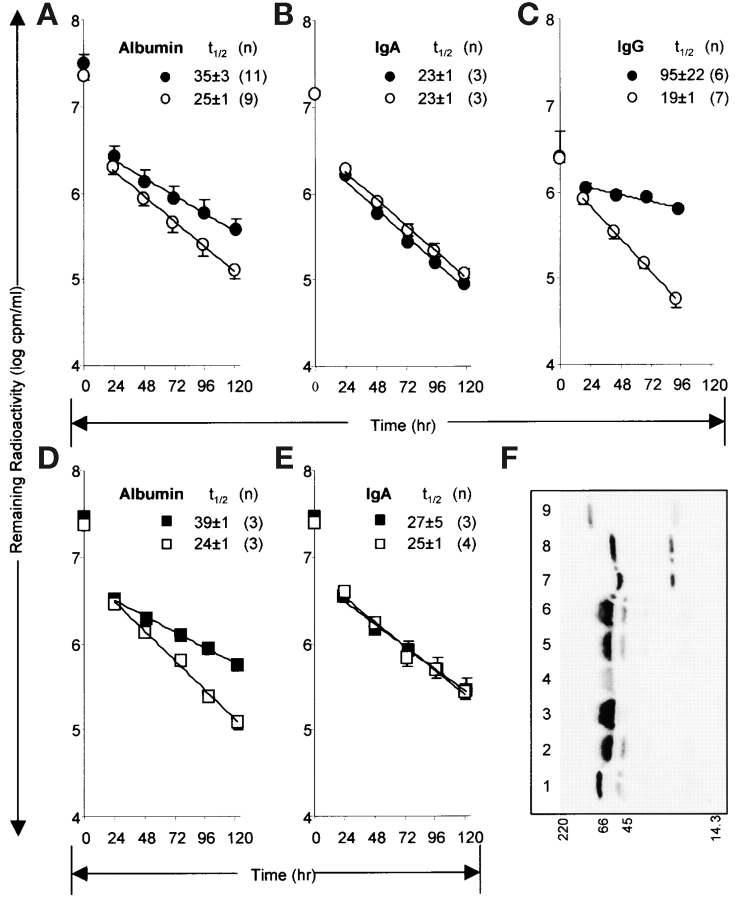
Decay of radioiodinated albumin in FcRn-deficient mice. A–C show the concentration of plasma radioactivity remaining at indicated times after intravenous infusion of b2m KO mice (open circles) and their WT control mice (filled circles) of radioiodinated albumin, IgA, and IgG, respectively. D and E show results for FcRn α-chain KO (open squares) and WT control mice (filled squares). Mean half-lives (t1/2) of β-phase decay in hours are shown with SD. The numbers of mice in each experiment are indicated by (n). Using a repeated measures ANOVA model to compare results between b2m KO and WT animals, we analyzed the logarithm of the ratio of the daily values with time 0 values (log ratios of plasma cpm). We found a statistically significant difference between the two groups of animals in the half-lives of both albumin and IgG during days 1 to 5 (both P values <0.0001). IgA and IgM (text only) values in the two strains of mice were not significantly different from one another (P = 0.4 and 0.9, respectively). For the experiment with FcRn α-chain KO and WT, the P value for albumin was <0.0001 while that for IgA was 0.3. F shows an autoradiograph of an SDS-PAGE of the radiolabeled proteins in the plasma of WT (lane 3) and FcRn α-chain KO (lane 4) mice at 120 h after infusion of radiolabeled albumin. The positions of molecular weight markers (M, in kD) are shown along bottom. Lanes 1, 2, 5, and 6 contain infused radiolabeled albumin equalized for the endogenous albumin content of the plasma samples by the addition, respectively, of 0, 0.75, 0.5, and 1.5 μl normal mouse plasma. Lanes 7 and 8 contain radioiodinated IgA containing 0 and 1.5 μl mouse serum, respectively. Lane 9 contains radioiodinated IgM. The experiment was repeated with 120 h plasma from a b2m KO mouse and WT control with equivalent results.
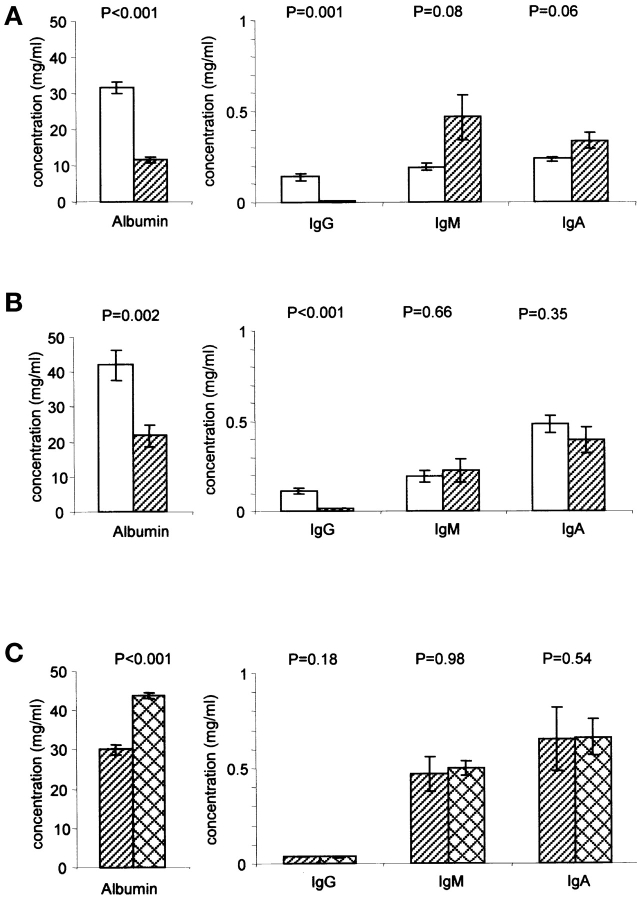
Plasma concentrations of albumin, IgG, IgA, and IgM in FcRn-deficient mice and in FcRn α-chain–deficient mice expressing a hFcRn transgene. Concentrations were determined by a sandwich ELISA. The specific KO, WT, transgenic strains and ages are given in Materials and Methods. Values are the means ± standard errors. P values are from Student's t test. Alternative significance statements using the nonparametric Mann-Whitney test give comparable results. (A) b2m KO (hatched bars) and corresponding wild-type (empty bars), six mice in each group. (B) FcRn α-chain KO (hatched bars) and corresponding wild-type (empty bars), eight mice in each group. (C) FcRn α-chain KO mice either expressing (crosshatched bars) or not expressing (hatched bars) a hFcRn transgene, five mice in each group.
References
-
- Peters, T., Jr. 1996. All About Albumin: Biochemistry, Genetics, and Medical Applications. Academic Press, New York.
-
- Freeman, T., and A.H. Gordon. 1965. Albumin catabolism in hypoproteinaemic states studied with 131I-Albumin. Bibl. Haematol. 1108–1115. - PubMed
-
- Cormode, E.J., D.M. Lyster, and S. Israels. 1975. Analbuminemia in a neonate. J. Pediatr. 86:862–867. - PubMed
-
- Waldmann, T.A., and W. Strober. 1969. Metabolism of immunoglobulins. Prog. Allergy. 13:1–110. - PubMed
-
- Schultze, H.E., and J.F. Heremans. 1966. Molecular biology of human proteins: with special reference to plasma proteins. Vol. 1. Nature and Metabolism of Extracellular Proteins. Elsevier, New York. 904 pp.
Publication types
MeSH terms
Substances
Grants and funding
LinkOut - more resources
Full Text Sources
Other Literature Sources
Molecular Biology Databases
