. 2003 Feb 3;197(3):353-61.
doi: 10.1084/jem.20021569.

Integrin-dependence of lymphocyte entry into the splenic white pulp

Affiliations

Integrin-dependence of lymphocyte entry into the splenic white pulp

Charles G Lo et al. J Exp Med. .

Abstract

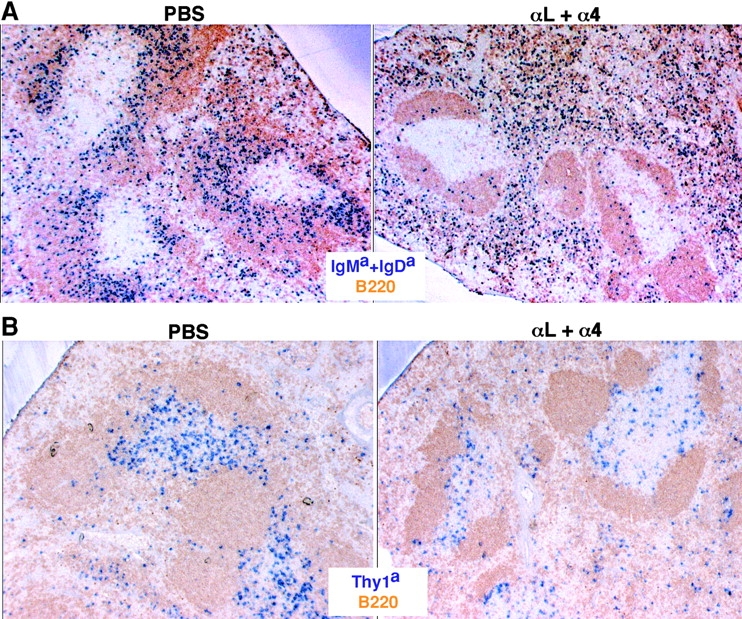
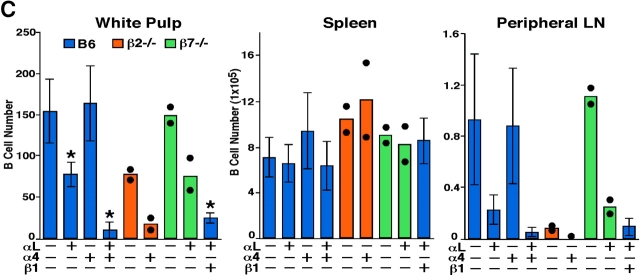
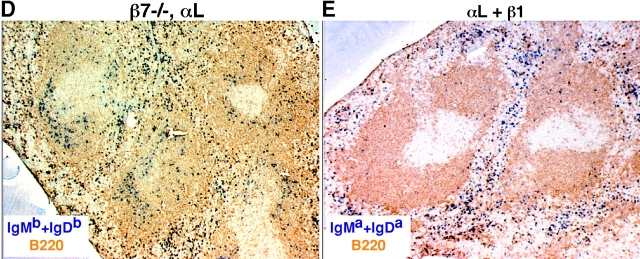
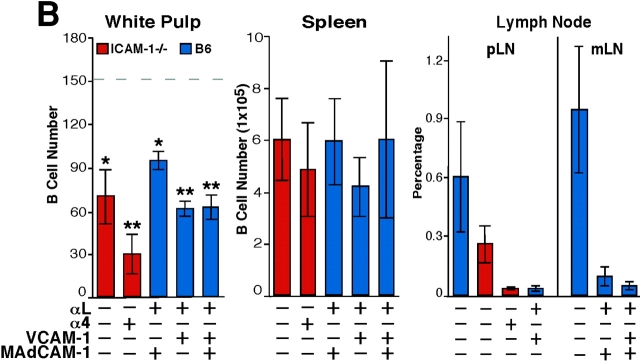
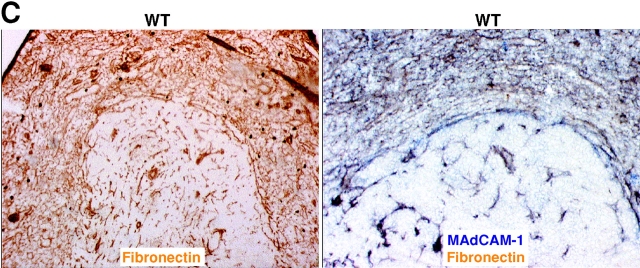
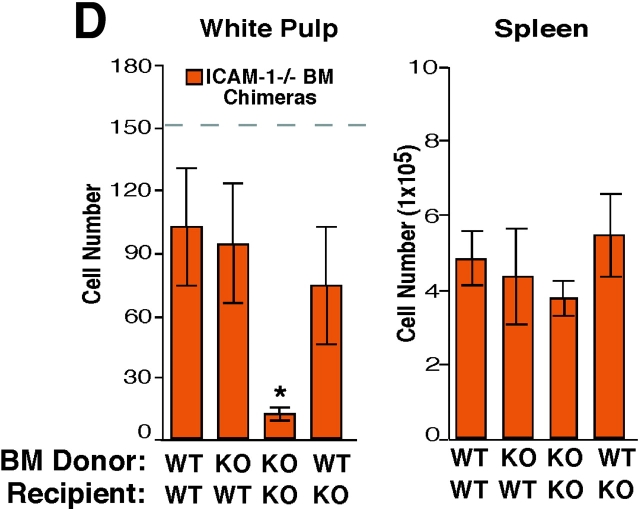
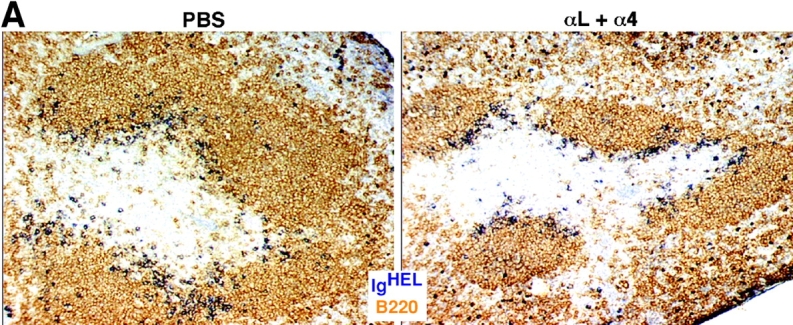
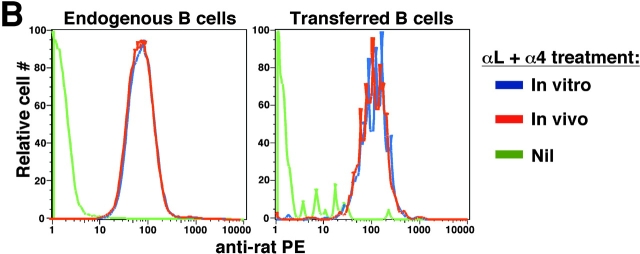
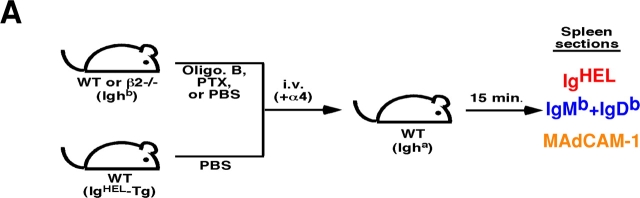
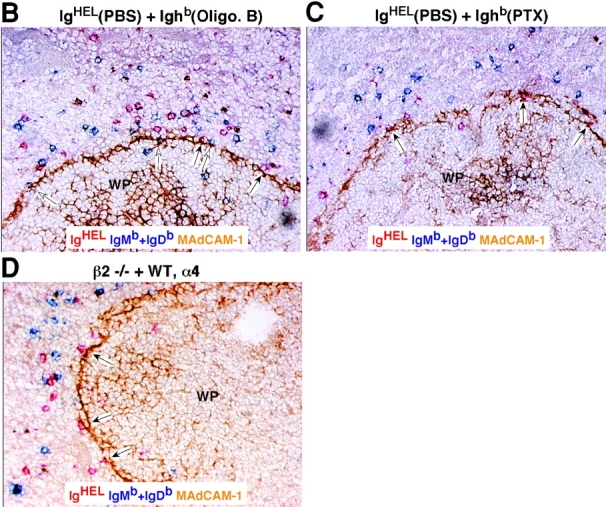
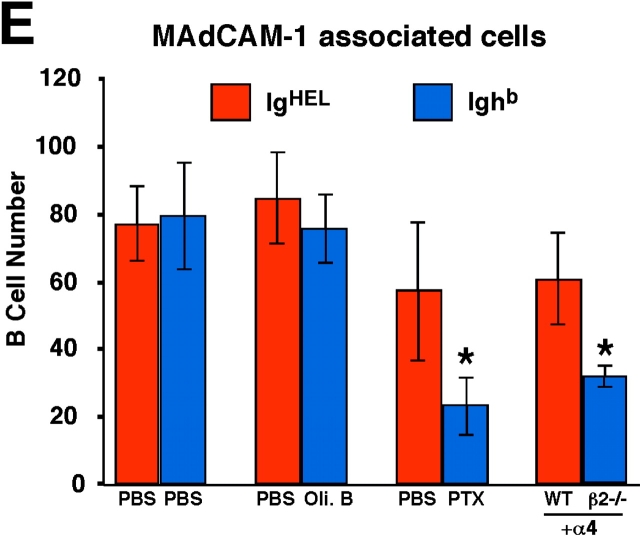
The steps involved in lymphocyte homing to the white pulp cords of the spleen are poorly understood. We demonstrate here that the integrins lymphocyte function associated (LFA)-1 and alpha 4 beta 1 make essential and mostly overlapping contributions necessary for B cell migration into white pulp cords. T cell entry to the white pulp is also reduced by blockade of LFA-1 and alpha 4 beta 1. The LFA-1 ligand, intercellular adhesion molecule 1 is critical for lymphocyte entry and both hematopoietic cells and radiation-resistant cells contribute to this requirement. Vascular cell adhesion molecule 1 contributes to the alpha 4 beta 1 ligand requirement and a second ligand, possibly fibronectin, also plays a role. By contrast with the entry requirements, antigen-induced movement of B cells from follicles to the outer T zone is not prevented by integrin blocking antibodies. Comparison of the distribution of integrin-blocked B cells and B cells treated with the G alpha i inhibitor, pertussis toxin, early after transfer reveals in both cases reduced accumulation in the inner marginal zone. These observations suggest that chemokine receptor signaling and the integrins LFA-1 and alpha 4 beta 1 function together to promote lymphocyte transit from the marginal zone into white pulp cords.


Figures

Figure 1.
Figure 1.
LFA-1 and α4β1 function in B and T cell entry into splenic white pulp cords. (A and B) Immunohistochemical analysis of spleen sections from B6 mice that had received WT Igha Thy1a spleen cells 3 h before and had been pretreated with PBS or αL and α4 neutralizing antibodies, as indicated, 1 h before cell transfer. Transferred B cells were detected by IgMa plus IgDa staining (A, blue), transferred T cells by Thy1a staining (B, blue), and endogenous B cells by B220 staining (brown). ×5. (C) Summary of B cell homing data showing the average number of transferred B cells per white pulp cross section (left), per one fifth of spleen (middle), and in a pool of inguinal and brachial lymph nodes (right). Donor cells were from WT, β2−/−, or β7−/− mice as indicated. Each bar shows the average (±SD) value for data from at least four animals of each type except for the β2−/− and β7−/− transfers where the individual data points are denoted by •. *, P < 0.05 compared with untreated WT controls. Similar enumeration was performed for T cells and the following average number of cells were detected per white pulp cord: PBS-treated, 218 ± 11 (n = 3); α4-treated, 242 (n = 1); αL-treated, 152 ± 13 (n = 3); αL plus α4-treated, 118 ± 14 (n = 4). (D and E) Immunohistochemical analysis of spleen sections from WT Igha B6 mice that had received β7−/− Ighb cells (D) or B6 mice that had received WT Igha spleen cells (E) and had been treated with integrin neutralizing antibodies, as indicated. Transferred B cells were detected by staining IgMb plus IgDb (D) or IgMa plus IgDa (E).
Figure 1.
Figure 1.
LFA-1 and α4β1 function in B and T cell entry into splenic white pulp cords. (A and B) Immunohistochemical analysis of spleen sections from B6 mice that had received WT Igha Thy1a spleen cells 3 h before and had been pretreated with PBS or αL and α4 neutralizing antibodies, as indicated, 1 h before cell transfer. Transferred B cells were detected by IgMa plus IgDa staining (A, blue), transferred T cells by Thy1a staining (B, blue), and endogenous B cells by B220 staining (brown). ×5. (C) Summary of B cell homing data showing the average number of transferred B cells per white pulp cross section (left), per one fifth of spleen (middle), and in a pool of inguinal and brachial lymph nodes (right). Donor cells were from WT, β2−/−, or β7−/− mice as indicated. Each bar shows the average (±SD) value for data from at least four animals of each type except for the β2−/− and β7−/− transfers where the individual data points are denoted by •. *, P < 0.05 compared with untreated WT controls. Similar enumeration was performed for T cells and the following average number of cells were detected per white pulp cord: PBS-treated, 218 ± 11 (n = 3); α4-treated, 242 (n = 1); αL-treated, 152 ± 13 (n = 3); αL plus α4-treated, 118 ± 14 (n = 4). (D and E) Immunohistochemical analysis of spleen sections from WT Igha B6 mice that had received β7−/− Ighb cells (D) or B6 mice that had received WT Igha spleen cells (E) and had been treated with integrin neutralizing antibodies, as indicated. Transferred B cells were detected by staining IgMb plus IgDb (D) or IgMa plus IgDa (E).
Figure 2.
Figure 2.
ICAM-1 and VCAM-1 function in B cell entry into splenic white pulp cords. (A) Immunohistochemical analysis of spleen sections from ICAM-1−/− or WT mice that had received Igha B6 spleen cells 3 h before and had been pretreated as indicated 1 h before cell transfer. Transferred cells were detected as described in Fig. 1. ×5. (B) Summary of transferred B cell homing data showing the average number of B cells per white pulp cross section (left), per one fifth of spleen (middle), and the frequency in a pool of inguinal and brachial lymph nodes (pLN) or in mesenteric lymph nodes (mLN) as indicated (right). Donor cells were from WT mice and the genotype of the recipient animals is indicated. The dashed line in the White Pulp panel indicates the average number of transferred WT cells reaching the white pulp in untreated controls as shown in Fig. 1. *, P < 0.05 compared with untreated WT controls; **, P < 0.05 compared with ICAM-1−/− or anti-αL–treated mice. (C) Fibronectin expression pattern in mouse spleen. Spleen sections from WT mice were stained to detect fibronectin alone (left, brown) or together with MAdCAM-1 (right, blue). (D) Summary of B cell homing data in ICAM-1−/− or control bone marrow chimeras treated with α4 blocking antibody. Recipient ICAM-1−/− or WT mice were reconstituted with ICAM-1−/− or WT bone marrow (BM), as indicated, treated with anti-α4, and transferred with WT cells. *, P < 0.05 compared with WT bone marrow chimeras. Cell number was enumerated as described in Materials and Methods. Each bar shows the average (±SD) value for data from at least four animals per group in B and three animals in D.
Figure 2.
Figure 2.
ICAM-1 and VCAM-1 function in B cell entry into splenic white pulp cords. (A) Immunohistochemical analysis of spleen sections from ICAM-1−/− or WT mice that had received Igha B6 spleen cells 3 h before and had been pretreated as indicated 1 h before cell transfer. Transferred cells were detected as described in Fig. 1. ×5. (B) Summary of transferred B cell homing data showing the average number of B cells per white pulp cross section (left), per one fifth of spleen (middle), and the frequency in a pool of inguinal and brachial lymph nodes (pLN) or in mesenteric lymph nodes (mLN) as indicated (right). Donor cells were from WT mice and the genotype of the recipient animals is indicated. The dashed line in the White Pulp panel indicates the average number of transferred WT cells reaching the white pulp in untreated controls as shown in Fig. 1. *, P < 0.05 compared with untreated WT controls; **, P < 0.05 compared with ICAM-1−/− or anti-αL–treated mice. (C) Fibronectin expression pattern in mouse spleen. Spleen sections from WT mice were stained to detect fibronectin alone (left, brown) or together with MAdCAM-1 (right, blue). (D) Summary of B cell homing data in ICAM-1−/− or control bone marrow chimeras treated with α4 blocking antibody. Recipient ICAM-1−/− or WT mice were reconstituted with ICAM-1−/− or WT bone marrow (BM), as indicated, treated with anti-α4, and transferred with WT cells. *, P < 0.05 compared with WT bone marrow chimeras. Cell number was enumerated as described in Materials and Methods. Each bar shows the average (±SD) value for data from at least four animals per group in B and three animals in D.
Figure 3.
Figure 3.
Inhibition of LFA-1 and α4 function does not prevent antigen-induced relocalization of B cells from follicles to the outer T zone. (A) Immunohistochemical analysis of spleen sections from mice that had received IgHEL transgenic B cells 1 d before, anti–LFA-1 and anti-α4 antibodies or PBS 8 h before, and 1 mg HEL antigen 6 h before. Transgenic B cells were detected by staining for HEL binding (blue) and endogenous B cells were detected with anti-B220 (brown). ×20. (B) Flow cytometric analysis to detect amounts of integrin blocking antibodies on the surface of B cells. Spleen cells from mice treated as described in A were either directly stained with anti–rat IgG (In vivo, red line), or after additional incubation in vitro with saturating amounts of anti–LFA-1 and anti-α4 (In vitro, blue line), and with antibodies to detect B220 and HEL. Levels of anti–rat IgG staining on B220+ HEL endogenous cells (left) or B220+ HEL+ transferred cells (right) are shown. Cells from mice that had not been injected with anti-integrin antibodies served as a negative control (Nil, green line).
Figure 3.
Figure 3.
Inhibition of LFA-1 and α4 function does not prevent antigen-induced relocalization of B cells from follicles to the outer T zone. (A) Immunohistochemical analysis of spleen sections from mice that had received IgHEL transgenic B cells 1 d before, anti–LFA-1 and anti-α4 antibodies or PBS 8 h before, and 1 mg HEL antigen 6 h before. Transgenic B cells were detected by staining for HEL binding (blue) and endogenous B cells were detected with anti-B220 (brown). ×20. (B) Flow cytometric analysis to detect amounts of integrin blocking antibodies on the surface of B cells. Spleen cells from mice treated as described in A were either directly stained with anti–rat IgG (In vivo, red line), or after additional incubation in vitro with saturating amounts of anti–LFA-1 and anti-α4 (In vitro, blue line), and with antibodies to detect B220 and HEL. Levels of anti–rat IgG staining on B220+ HEL endogenous cells (left) or B220+ HEL+ transferred cells (right) are shown. Cells from mice that had not been injected with anti-integrin antibodies served as a negative control (Nil, green line).
Figure 4.
Figure 4.
PTX and integrin blocking affect B cell entry into white pulp cords at a similar early step. (A) Mixed adoptive transfers were performed using spleen cells from WT Ighb mice that were treated in vitro with PBS, oligomer B (Oli. B), or PTX and transferred intravenously to WT Igha recipients together with equal numbers of PBS-treated WT IgHEL transgenic cells. Alternatively, β2−/− Ighb spleen cells were mixed with WT IgHEL transgenic cells and transferred to anti-α4 antibody–treated recipients. 15 min after transfer, recipient spleens were isolated and subjected to immunohistochemical analysis as indicated. (B–D) Three color immunohistochemical analysis of spleen sections from mice that had received a mixture of oligomer B– (B) or PTX–treated (C) spleen cells and PBS-treated IgHEL transgenic internal control cells, or from mice that had been pretreated with anti-α4 antibody and received a mixture of β2−/− and IgHEL transgenic cells (D). Sections were stained for IgMb plus IgDb (blue) to detect treated or β2−/− B cells, HEL (red) to detect IgHEL transgenic B cells, and MAdCAM-1 (brown) to highlight the boundary between the marginal zone and white pulp. Filled arrows identify control IgHEL B cells (red) and open arrows identify treated or β2−/− B cells (blue) in the inner marginal zone (defined by physical association with the MAdCAM-1–stained cells). WP, white pulp. ×20. (E) Summary of data showing inhibitory effect of PTX treatment and integrin blocking on B cell localization in the inner marginal zone. Transferred cells were identified as indicated in A and the number of cells in the inner marginal zone was enumerated as exemplified by the cells indicated by arrows in B–D. More than 12 separate cross sections from each spleen were enumerated and between 2 and 4 spleens of each type were analyzed. *, P < 0.05 compared with IgHEL transgenic internal control cells.
Figure 4.
Figure 4.
PTX and integrin blocking affect B cell entry into white pulp cords at a similar early step. (A) Mixed adoptive transfers were performed using spleen cells from WT Ighb mice that were treated in vitro with PBS, oligomer B (Oli. B), or PTX and transferred intravenously to WT Igha recipients together with equal numbers of PBS-treated WT IgHEL transgenic cells. Alternatively, β2−/− Ighb spleen cells were mixed with WT IgHEL transgenic cells and transferred to anti-α4 antibody–treated recipients. 15 min after transfer, recipient spleens were isolated and subjected to immunohistochemical analysis as indicated. (B–D) Three color immunohistochemical analysis of spleen sections from mice that had received a mixture of oligomer B– (B) or PTX–treated (C) spleen cells and PBS-treated IgHEL transgenic internal control cells, or from mice that had been pretreated with anti-α4 antibody and received a mixture of β2−/− and IgHEL transgenic cells (D). Sections were stained for IgMb plus IgDb (blue) to detect treated or β2−/− B cells, HEL (red) to detect IgHEL transgenic B cells, and MAdCAM-1 (brown) to highlight the boundary between the marginal zone and white pulp. Filled arrows identify control IgHEL B cells (red) and open arrows identify treated or β2−/− B cells (blue) in the inner marginal zone (defined by physical association with the MAdCAM-1–stained cells). WP, white pulp. ×20. (E) Summary of data showing inhibitory effect of PTX treatment and integrin blocking on B cell localization in the inner marginal zone. Transferred cells were identified as indicated in A and the number of cells in the inner marginal zone was enumerated as exemplified by the cells indicated by arrows in B–D. More than 12 separate cross sections from each spleen were enumerated and between 2 and 4 spleens of each type were analyzed. *, P < 0.05 compared with IgHEL transgenic internal control cells.

Similar articles

Cited by

References

    1. Bohnsack, J.F., and E.J. Brown. 1986. The role of the spleen in resistance to infection. Annu. Rev. Med. 37:49–59. - PubMed
    1. Kraal, G. 1992. Cells in the marginal zone of the spleen. Int. Rev. Cytol. 132:31–73. - PubMed
    1. Yamamoto, K., T. Kobayashi, and T. Murakami. 1982. Arterial terminals in the rat spleen as demonstrated by scanning electron microscopy of vascular casts. Scan. Electron Microsc. 1:455–458. - PubMed
    1. Schmidt, E.E., I.C. MacDonald, and A.C. Groom. 1993. Comparative aspects of splenic microcirculatory pathways in mammals: the region bordering the white pulp. Scanning Microsc. 7:613–628. - PubMed
    1. Steiniger, B., P. Barth, and A. Hellinger. 2001. The perifollicular and marginal zones of the human splenic white pulp: do fibroblasts guide lymphocyte immigration? Am. J. Pathol. 159:501–512. - PMC - PubMed

Publication types

MeSH terms