. 2003 Feb 3;160(3):423-32.
doi: 10.1083/jcb.200210020.

The ZO-1-associated Y-box factor ZONAB regulates epithelial cell proliferation and cell density

Affiliations

The ZO-1-associated Y-box factor ZONAB regulates epithelial cell proliferation and cell density

Maria S Balda et al. J Cell Biol. .

Abstract

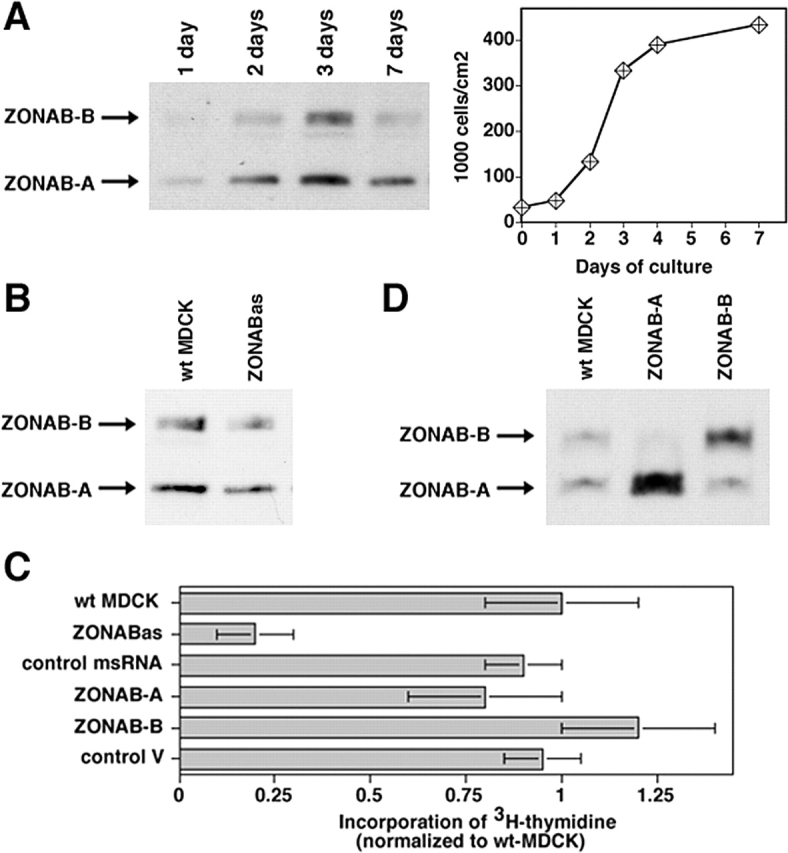
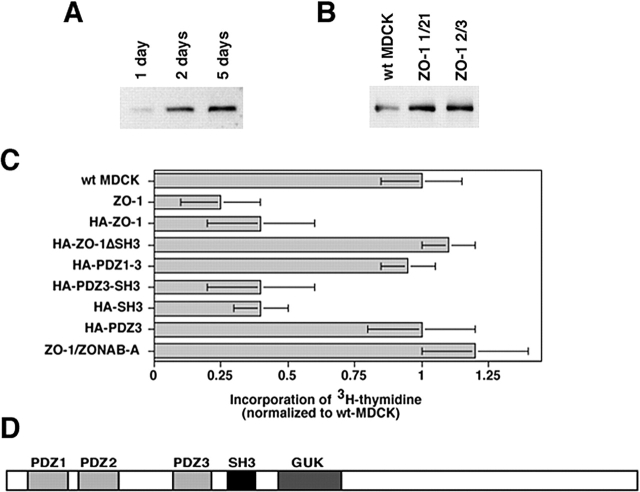
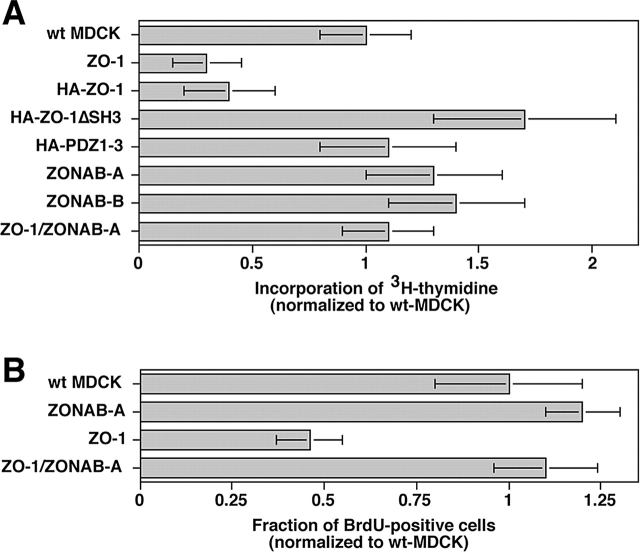
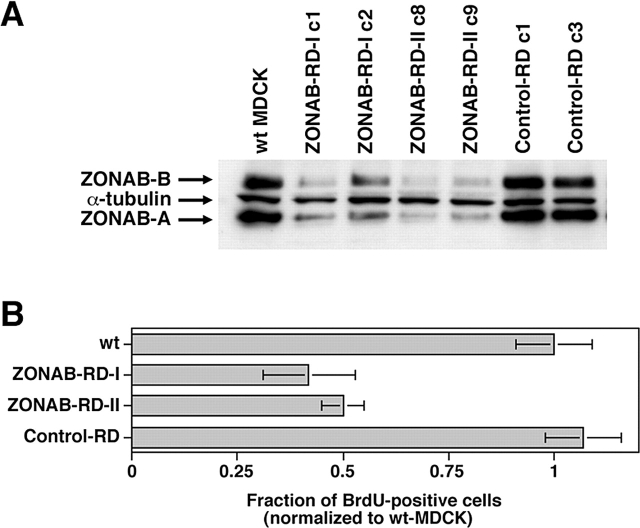
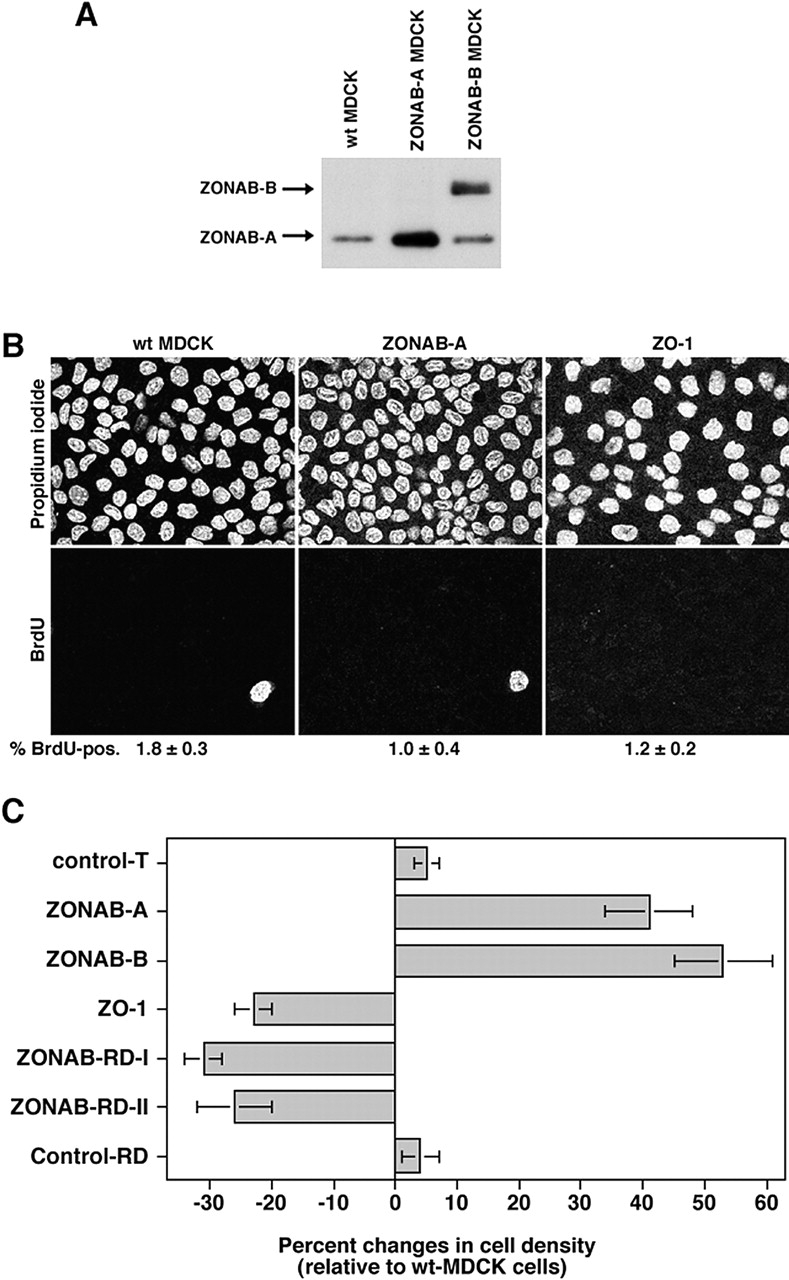
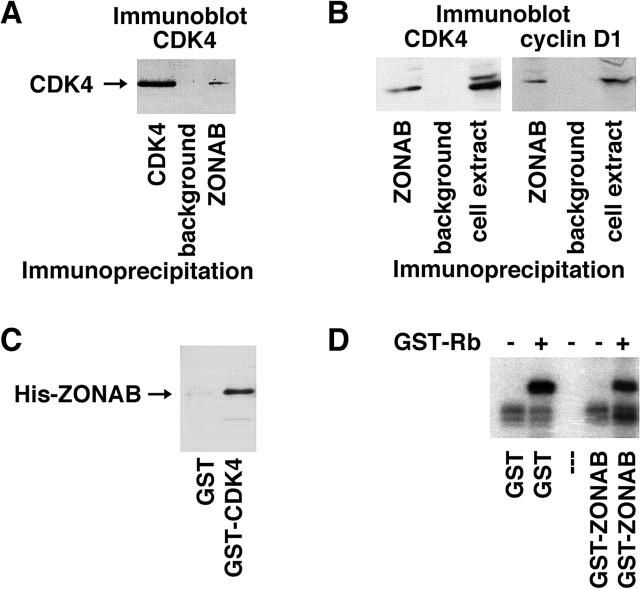
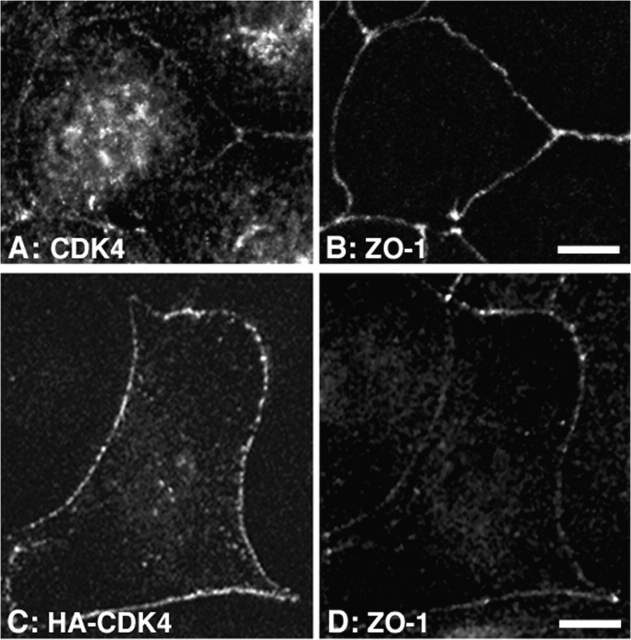
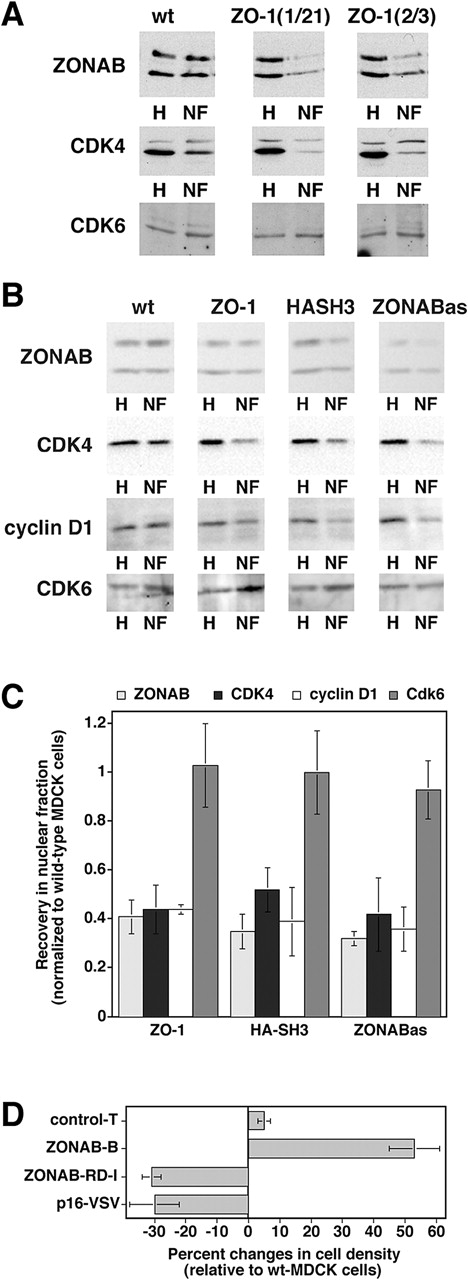
Epithelial tight junctions regulate paracellular permeability, restrict apical/basolateral intramembrane diffusion of lipids, and have been proposed to participate in the control of epithelial cell proliferation and differentiation. Previously, we have identified ZO-1-associated nucleic acid binding proteins (ZONAB), a Y-box transcription factor whose nuclear localization and transcriptional activity is regulated by the tight junction-associated candidate tumor suppressor ZO-1. Now, we found that reduction of ZONAB expression using an antisense approach or by RNA interference strongly reduced proliferation of MDCK cells. Transfection of wild-type or ZONAB-binding fragments of ZO-1 reduced proliferation as well as nuclear ZONAB pools, indicating that promotion of proliferation by ZONAB requires its nuclear accumulation. Overexpression of ZONAB resulted in increased cell density in mature monolayers, and depletion of ZONAB or overexpression of ZO-1 reduced cell density. ZONAB was found to associate with cell division kinase (CDK) 4, and reduction of nuclear ZONAB levels resulted in reduced nuclear CDK4. Thus, our data indicate that tight junctions can regulate epithelial cell proliferation and cell density via a ZONAB/ZO-1-based pathway. Although this regulatory process may also involve regulation of transcription by ZONAB, our data suggest that one mechanism by which ZONAB and ZO-1 influence proliferation is by regulating the nuclear accumulation of CDK4.


Figures

Figure 1.
Figure 1.
Regulation of proliferation by ZONAB. (A) MDCK cells were grown for the indicated amounts of days. Cultures were harvested and equal amounts of protein were loaded on SDS-PAGE gels for analysis of ZONAB expression by immunoblotting. The bands representing the ZONAB-A and -B isoforms are indicated. Parallel cultures were trypsinized, and the cells were counted to determine the cell density. (B) Reduction of ZONAB expression in low density cells by ZONAB antisense RNA. Proliferating wild-type MDCK cells (wt MDCK) and cells expressing ZONAB antisense RNA (ZONABas) were harvested, and equal amounts of protein were loaded on SDS-PAGE gels for analysis of ZONAB expression by immunoblotting. Based on densitometric scanning of the immunoblots, expression of ZONAB was reduced by >50% in cells transfected with the antisense construct. (C) Proliferation of low density MDCK cells expressing ZONAB antisense RNA (ZONABas), a control missense RNA (msRNA), overexpressing either one of the ZONAB isoforms, or transfected with a control cDNA were analyzed by measuring incorporation of [3H]thymidine. Data were normalized to wild-type cells (shown are means ± 1 SD of at least three independent clones per construct that were analyzed in three independent experiments with quadruplicate cultures). Note that incorporation of [3H]thymidine by ZONABas cells was reduced by >70% (t test; P < 0.01). (D) Overexpression of ZONAB isoforms in low density MDCK cells. Proliferating wild-type MDCK cells (wt MDCK) and cells overexpressing ZONAB-A or ZONAB-B were harvested, and equal amounts of protein were loaded on SDS-PAGE gels for analysis of ZONAB expression by immunoblotting.
Figure 2.
Figure 2.
Regulation of proliferation by ZO-1. (A and B) Expression of ZO-1 in wild-type and transfected MDCK cells. Wild-type MDCK cells (A) or wild-type (wt MDCK) and ZO-1–overexpressing (ZO-1 1/21 and ZO-1 2/3) cells (B) were grown for the indicated number of days as described in Fig. 1 A. Cells were then harvested, and equal amounts of protein were loaded on SDS-PAGE gels for analysis of ZO-1 expression by immunoblotting. Note that ZO-1 was overexpressed in transfected proliferating cells to a similar extent as it was up-regulated in mature monolayers. (C) Incorporation of [3H]thymidine by low density MDCK cells stably transfected with ZO-1 or HA-tagged ZO-1 with (HA-ZO-1) or without (HA-ZO-1ΔSH3) the SH3 domain, or constructs containing specified domains. ZO-1/ZONAB indicates data obtained from double transfected cells overexpressing both proteins. Data were normalized to wild-type cells (shown are means ± 1 SD of at least three independent clones per construct that were analyzed in three independent experiments with quadruplicate cultures). Note that all cell lines expressing constructs containing the SH3 domain of ZO-1 exhibited significantly reduced [3H]thymidine incorporation (t test; P < 0.05). (D) Domain structure of ZO-1. PDZ, PSD95-DlgA-ZO-1 homology domain; SH3, src homology domain 3; GUK, guanylate kinase homology domain.
Figure 3.
Figure 3.
Regulation of G1/S-phase transition by ZO-1 and ZONAB. Wild-type (wt MDCK) and transfected MDCK cells expressing the indicated cDNAs were plated at low confluence and then synchronized in low serum. Cell cycle entry was then triggered by serum addition, and progression to S-phase was monitored by measuring incorporation of [3H]thymidine (A) or BrdU (B). Note, whereas in A total DNA synthesis was measured, B shows the fraction of cells in S-phase. Expression of full-length ZO-1 significantly inhibited entry into S-phase (t test; A, P < 0.05; B, P < 0.01). Shown are means ± 1 SD of three independent clones per construct that were analyzed in at least three different experiments performed in quadruplicate.
Figure 4.
Figure 4.
Depletion of ZONAB by RNA interference inhibits G1/S-phase transition. (A) Wild-type MDCK cells or cells stably expressing RNA duplexes corresponding to region I (ZONAB-RD-I c1 and c2) or II (ZONAB-RD-II c8 and c9) of ZONAB, or control RNA duplexes (control-RD c1 and c3) were grown for 2 d and then lysed and processed for electrophoresis. The samples were immunoblotted with anti-ZONAB and anti–α-tubulin antibodies. (B) Wild-type and transfected MDCK cells expressing the indicated RNA duplexes were plated at low confluence and synchronized in low serum. Cell cycle entry was triggered by serum addition, and progression to S-phase was monitored by determining the fraction of cell incorporation of BrdU. Shown are means ± 1 SD of at least two independent clones per type of RNA duplex that were analyzed in two independent experiments. Both ZONAB-directed RNA duplexes significantly inhibited entry into S-phase (t test; P < 0.02).
Figure 5.
Figure 5.
Regulation of final cell density by ZONAB. (A) Expression of ZONAB in high density wild-type and transfected MDCK cells. Wild-type (wt MDCK) and ZONAB-A or -B overexpressing cells were grown for 7 d. Cells cultured for 7 d had reached maximal cell density. Cultures were harvested, and equal amounts of protein were loaded on SDS-PAGE gels for analysis of ZONAB expression by immunoblotting. (B) Cell cycle arrest of high density MDCK cells. Wild-type or transfected MDCK cells overexpressing ZO-1 or ZONAB were grown to full density, and cell cycle arrest was determined by BrdU incorporation. Shown are representative images of propidium iodide and BrdU labelings, and the indicated numbers are the percentage of BrdU-positive cells (averages of two independent experiments are shown). Note the different cell densities in the propidium iodide staining. (C) Cell density of mature monolayers. Cells grown as those in B were harvested and counted. The cell number per cm2 of culture was calculated and expressed as percent changes relative to wild-type MDCK cells. The value shown for control transfections (control T) represents cell densities obtained from cell lines expressing three different control cDNAs generated with the same expression vector. Shown are averages ± 1 SD of independent clones that were analyzed twice independently using triplicate cultures. Analyzed were three different clones expressing ZONAB-A, three ZONAB-RD-I clones, and two independent clones each for ZONAB-B, ZO-1, ZONAB-RD-II, and Control-RD. All cell lines with the exception of the two types of control transfection were significantly different from wild-type cells (t test; P < 0.05).
Figure 6.
Figure 6.
Interaction of ZONAB with CDK4. MDCK cells were extracted under stringent conditions (A) or in PBS-Triton X-100 (B), and cell extracts were subjected to immunoprecipitation with the indicated antibodies. CDK4 and cyclin D1 were then detected by immunoblotting using a γ-chain–specific secondary antibody. (C) In vitro interaction between recombinant His-tagged ZONAB and GST-tagged CDK4. Glutathione beads loaded with either GST or GST-CDK4 were incubated with His-tagged ZONAB fusion protein. The beads were then washed, and pull-down was monitored by immunoblotting. A His-tagged control fusion protein was not detected in the precipitates (not depicted). (D) Kinase activity of recombinant CDK4/cyclin D1 was assayed in the presence of recombinant GST-ZONAB or GST using GST-retinoblastoma (GST-Rb) as a substrate. Note that CDK4 activity was not affected by GST-ZONAB.
Figure 7.
Figure 7.
Association of CDK4 with intercellular junctions. (A and B) MDCK cells were plated on coverslips and grown for 3 d. The cells were then fixed with methanol and processed for double immunofluorescence using rabbit anti-CDK4 and rat anti–ZO-1 antibodies. Shown are confocal XY-sections (A, CDK4; B, ZO-1 staining). (C and D) Confocal XY-sections of MDCK cells transiently transfected with a cDNA coding for HA-tagged CDK4. The cells were stained with rabbit anti-HA and rat anti–ZO-1 antibodies (C, HA-CDK4; D, ZO-1 staining). Bars, 10 μm.
Figure 8.
Figure 8.
Regulation of CDK4 accumulation in the nucleus. (A) Nuclear fractions isolated from low density wild-type and ZO-1–overexpressing MDCK cells were immunoblotted for the indicated proteins. Equal amounts of protein were loaded for all homogenates and for all nuclear fractions. The weak upper band in the CDK4 blot is a background band that was only detected by early batches of the commercial anti-CDK4 antibody, but not by later ones (see panel B for comparison). (B) Wild-type cells, clones transfected with cDNAs for either ZO-1 or the HA-tagged SH3 (HASH3), or cells expressing antisense ZONAB RNA (ZONABas) were grown, franctionated, and analyzed as in the experiment shown in A. To increase the sensitivity and accuracy of quantification, higher amounts of nuclear protein were loaded in B as compared with A to obtain bands with a similar intensity. (C) Quantification of nuclear accumulation. Immunoblots such as those shown in B were quantified by densitometric scanning, and the ratio of nuclear versus total signal was calculated. For each experiment, the ratio obtained from wild-type cells was set to 1 and the other cell lines were normalized to this value. Shown are averages ± 1 SD from at least three independent experiments. The values obtained for ZONAB, CDK4, and cyclin D1 in ZO-1, HA-SH3, and ZONABas cells were significantly different from those of wild-type cells with a confidence level of P < 0.02. (D) Reduced cell density in cells expressing a CDK4 inhibitor. Wild-type and transfected MDCK cells were grown as in Fig. 5 C, and were then harvested and counted. The cell number per cm2 of culture was calculated and expressed as percent changes relative to wild-type MDCK cells. Two independent clones expressing VSV-tagged p16-INK4a were analyzed in two independent experiments performed in triplicate. For comparison, the values of ZONAB-overexpressing or depleted clones from Fig. 5 are also shown. Note that expression of p16-INK4a significantly reduced the final cell density (t test; P < 0.05).

References

    1. Assoian, R.K., and M.A. Schwartz. 2001. Coordinate signaling by integrins and receptor tyrosine kinases in the regulation of G1 phase cell-cycle progression. Curr. Opin. Genet. Dev. 11:48–53. - PubMed
    1. Balda, M.S., and K. Matter. 2000. The tight junction protein ZO-1 and an interacting transcription factor regulate ErbB-2 expression. EMBO J. 19:2024–2033. - PMC - PubMed
    1. Balda, M.S., J.A. Whitney, C. Flores, S. González, M. Cereijido, and K. Matter. 1996. Functional dissociation of paracellular permeability and transepithelial electrical resistance and disruption of the apical-basolateral intramembrane diffusion barrier by expression of a mutant tight junction membrane protein. J. Cell Biol. 134:1031–1049. - PMC - PubMed
    1. Bargou, R.C., K. Jurchott, C. Wagener, S. Bergmann, S. Metzner, K. Bommert, M.Y. Mapara, K.J. Winzer, M. Dietel, B. Dorken, and H.D. Royer. 1997. Nuclear localization and increased levels of transcription factor YB-1 in primary human breast cancers are associated with intrinsic MDR1 gene expression. Nat. Med. 3:447–450. - PubMed
    1. Behrens, J. 1999. Cadherins and catenins: role in signal transduction and tumor progression. Cancer Metastasis Rev. 18:15–30. - PubMed

Publication types

MeSH terms