. 2003 Feb;15(2):365-79.
doi: 10.1105/tpc.006999.

HLM1, an essential signaling component in the hypersensitive response, is a member of the cyclic nucleotide-gated channel ion channel family

Affiliations

HLM1, an essential signaling component in the hypersensitive response, is a member of the cyclic nucleotide-gated channel ion channel family

Claudine Balagué et al. Plant Cell. 2003 Feb.

Abstract

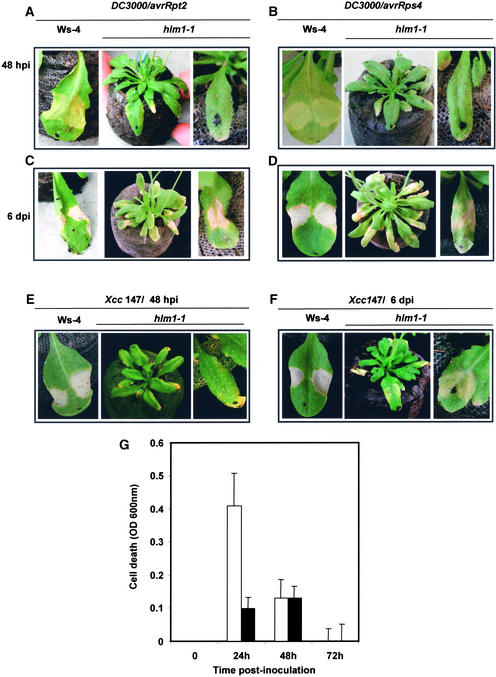
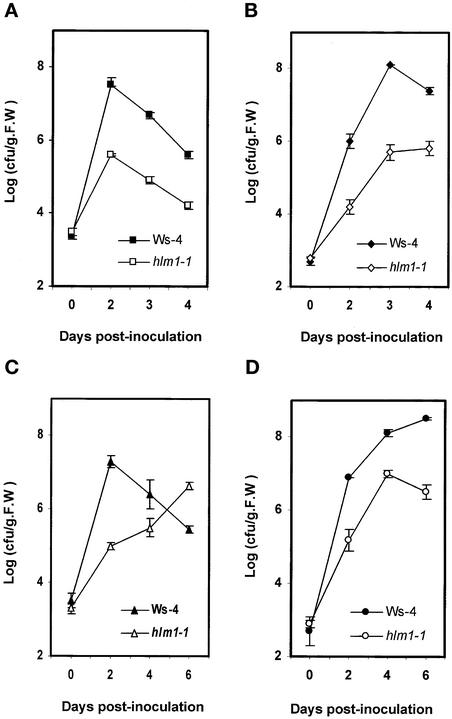
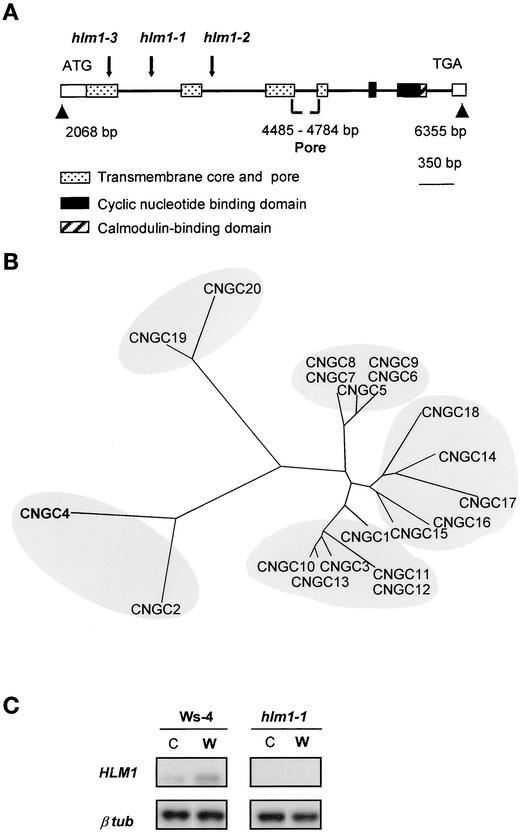
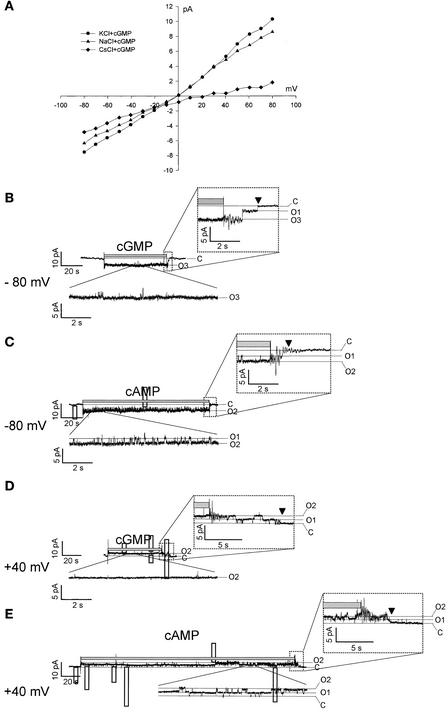
The hypersensitive response (HR) in plants is a programmed cell death that is commonly associated with disease resistance. A novel mutation in Arabidopsis, hlm1, which causes aberrant regulation of cell death, manifested by a lesion-mimic phenotype and an altered HR, segregated as a single recessive allele. Broad-spectrum defense mechanisms remained functional or were constitutive in the mutant plants, which also exhibited increased resistance to a virulent strain of Pseudomonas syringae pv tomato. In response to avirulent strains of the same pathogen, the hlm1 mutant showed differential abilities to restrict bacterial growth, depending on the avirulence gene expressed by the pathogen. The HLM1 gene encodes a cyclic nucleotide-gated channel, CNGC4. Preliminary study of the HLM1/CNGC4 gene pro-duct in Xenopus oocytes (inside-out patch-clamp technique) showed that CNGC4 is permeable to both K(+) and Na(+) and is activated by both cGMP and cAMP. HLM1 gene expression is induced in response to pathogen infection and some pathogen-related signals. Thus, HLM1 might constitute a common downstream component of the signaling pathways leading to HR/resistance.


Figures

Figure 1.
Figure 1.
Lesion-Mimic Phenotypes Associated with the hlm1 Mutation. (A) Four-week-old plants photographed at the same distance. The three mutant alleles exhibit similar lesions and alterations in growth and morphology compared with Ws-4. (B) Spontaneous lesion formation in hlm1 mutant plants. A representative leaf of a 3-week-old plant, and the lesions observed with a microscope (Zeiss Axiophot), are shown. Bars = 100 μm. (C) Staining of leaves with Evans blue reveals the presence of numerous microscopic lesions consisting of clusters of a few dead cells. (D) Observation of leaves with a fluorescence microscope (Zeiss Axiophot using an FT510 filter) shows autofluorescence corresponding to the lesions observed in (B).
Figure 2.
Figure 2.
Defense Gene Expression and SA Levels in Wild-Type and hlm1 Plants. (A) Transcript levels of the PR1 (Pathogenesis-Related1), CHIB (Chitinase B), GST2 (Glutathione Sulfo-Transferase2), and PDF1-2 genes in wild-type (Ws-4) and hlm1 plants as determined by RNA gel blot analysis at 14, 21, and 28 days after sowing. (B) Total SA levels in wild-type (Ws-4) (hatched bars) and hlm1 (closed bars) plants. Leaves were harvested from plants grown on soil under short-day conditions. SA measurements and standard errors are derived from four replicates. F.W., fresh weight.
Figure 3.
Figure 3.
HR Phenotypes of hlm1 Plants in Response to Diverse Avirulent Pathogens. (A) to (D) Leaves from wild-type (Ws-4) and hlm1 plants after inoculation with Pseudomonas DC3000 containing the avrRpt2 gene ([A] and [C]) or the avrRps4 gene ([B] and [D]) at 48 h after inoculation (hpi; [A] and [B]) or 6 days after inoculation (dpi; [C] and [D]). (E) and (F) Leaves from wild-type (Ws-4) and hlm1 plants after inoculation with the avirulent strain of Xanthomonas (Xcc 147) at 48 h (E) and 6 days (F) after inoculation. Dots on the leaves indicate inoculated leaves. Three days after inoculation with strains 147, DC3000/avrRps4, and DC3000/avrRpt2, 10, 11, and 27% of the inoculated leaves, respectively, responded when inocula of 5 × 10⁷ cfu/mL were used, whereas 100% of leaves responded in the case of wild-type control plants. Six days after inoculation, 80, 80, and 71% of leaves responded to the same strains, respectively, showing either chlorotic symptoms (avrRps4 and Xanthomonas strain 147) or HR-like symptoms (avrRpt2). (G) Evaluation of cell death in wild-type (open bars) and hlm1 (closed bars) leaves after inoculation with avirulent strain 147 of Xanthomonas. Uptake of Evans blue by leaves was quantified by spectrophotometry. Data are expressed as OD units and result from four independent experiments.
Figure 4.
Figure 4.
In Planta Growth of Virulent and Avirulent Strains of Pseudomonas in hlm1. Growth of avirulent Pseudomonas expressing the avrRpm1 gene (A), the avrRpt2 gene (B), or the avrRps4 gene (C) and of virulent Pseudomonas (DC3000) (D) in wild-type (Ws-4) and hlm1 plants. Inoculation was performed with a bacterial suspension of 105 cfu/mL, and bacterial growth determinations were performed at the times indicated. Mean bacterial densities are shown (three replicates with corresponding standard deviations) for one representative experiment from two to three independent experiments performed with each strain. F.W., fresh weight.
Figure 5.
Figure 5.
RNA Gel Blot Analysis of the Expression of Defense Genes (PR1, PDF1-2, and Athsr3) and CNGC2 in Wild-Type (Ws-4) and hlm1 Plants at Different Times (Hours) after Inoculation with the Avirulent Strain of Xanthomonas (Xcc 147) or with Water. Similar results (not shown) were obtained in a second independent experiment.
Figure 6.
Figure 6.
Genetic and Molecular Identification of the HLM1 Gene. (A) Genomic organization of hlm1-1, hlm1-2, and hlm1-3. Arrows indicate the insertion site of the T-DNA in each mutant allele within the HLM1 gene sequence. Gene organization in exons (open box) and introns (thick black line) and the localization of the different domains of the deduced protein are presented. (B) Comparison of the predicted HLM1/CNGC4 protein with the other members of the CNGC family. The phylogenetic tree of Arabidopsis CNGC proteins was drawn using the Treeview program (http://taxonomy.zoology.gla.uk/rod/treeview.html) after alignment of the putative pore region with the CLUSTAL X program (Thompson et al., 1997). The regions delimiting the pore domains were deduced from the available cDNA sequences or predicted by a hydrophobicity profile of the protein (Kyte and Doolittle, 1982) and/or by sequence homology with animal CNGCs. The CNGCs identified are named according to Maser et al. (2001). (C) Reverse transcriptase–mediated PCR analysis of HLM1/CNGC4 transcript accumulation at 24 h after treatment in wild-type (Ws-4) and hlm1-1 leaves untreated (C) or infiltrated with water (W). HLM1, an 887-bp region of the HLM1 transcript; β tub, a 317-bp region of the β-tubulin4 gene.
Figure 7.
Figure 7.
Single-Channel Currents Recorded (Inside-Out Configuration) through a Membrane Patch Excised from a CNGC4 cRNA–Injected Oocyte. (A) Current-voltage relationship for a patch facing 100 mM KCl (circles), 100 mM NaCl (triangles), or 100 mM CsCl (diamonds) with saturating 0.5 mM cGMP. The pipette contained 100 mM KCl. The background currents (i.e., in the absence of cGMP) were subtracted for each trace. (B) to (E) Current traces from the same patch described in (A), with the cytosolic face exposed to 100 mM KCl plus 0.5 mM cGMP ([B] and [D]) or plus 0.5 mM cAMP ([C] and [E]), at the times indicated by the gray bar above the traces and the membrane potentials indicated. A record sample, in the presence of cNMP at steady state, is shown magnified in the inset below each current trace. The time course of the current after the removal of the cNMP is shown magnified in the inset above each current trace. C, the leak-current level (channels closed); 01–03, the current levels corresponding to one to three open channels.
Figure 8.
Figure 8.
HLM1/CNGC4 Expression after Pathogen Inoculation. (A) HLM1 and PR1 transcript accumulation in wild-type plants (Col-0 and Ws-4) at different times after inoculation (0, 8, and 24 h) with an avirulent strain of Xanthomonas. (B) Histochemical localization of GUS activity in leaves from transgenic plants containing a HLM1 promoter–GUS or a CNGC2 promoter–GUS fusion gene, both healthy (H) and after inoculation with the avirulent strain of Xanthomonas (Xcc 147; I) or water (C). Undetached leaves were infiltrated in a small region (1 cm2) with the bacterial strain at 108 cfu/mL, and the leaves were collected at the times (hours) indicated after inoculation (hpi). Arrows indicate the localization of inoculated zones.

References

    1. Aarts, N., Metz, M., Holub, E., Staskawicz, B.J., Daniels, M.J., and Parker, J.E. (1998). Different requirements for EDS1 and NDR1 by disease resistance genes define at least two R gene-mediated signaling pathways in Arabidopsis. Proc. Natl. Acad. Sci. USA 95, 10306–10311. - PMC - PubMed
    1. Anderson, K.V. (2000). Toll signaling pathways in the innate immune response. Curr. Opin. Immunol. 12, 13–19. - PubMed
    1. Atkinson, M.M., Keppler, L.D., Orlandi, E.W., Baker, C.J., and Mischke, C.F. (1990). Involvement of plasma membrane calcium influx in bacterial induction of the K+/H+ and hypersensitive responses in tobacco. Plant Physiol. 92, 215–221. - PMC - PubMed
    1. Baillieul, F., Genetet, I., Kopp, M., Saindrenan, P., Fritig, B., and Kauffman, S. (1995). A new elicitor of the hypersensitive response in tobacco: A fungal glycoprotein elicits cell death, expression of defense genes, production of salicylic acid, and induction of systemic acquired resistance. Plant J. 8, 551–560. - PubMed
    1. Baker, C.J., and Mock, N.M. (1994). An improved method for monitoring cell death in cell suspension and leaf disc assays using Evans blue. Plant Cell Tissue Organ Cult. 39, 7–12.

Publication types

MeSH terms