. 2003 Feb;15(2):425-38.
doi: 10.1105/tpc.006759.

Duplicated fie genes in maize: expression pattern and imprinting suggest distinct functions

Affiliations

Duplicated fie genes in maize: expression pattern and imprinting suggest distinct functions

Olga N Danilevskaya et al. Plant Cell. 2003 Feb.

Abstract

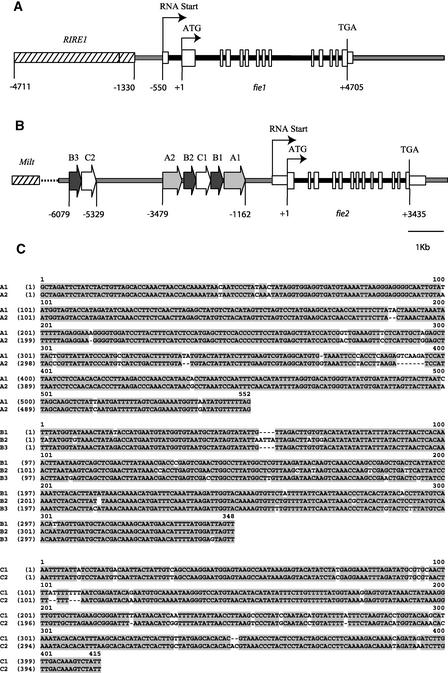
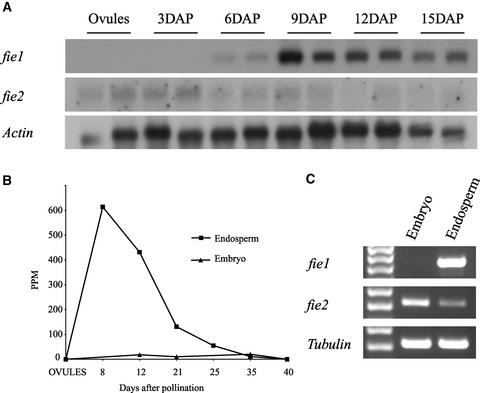
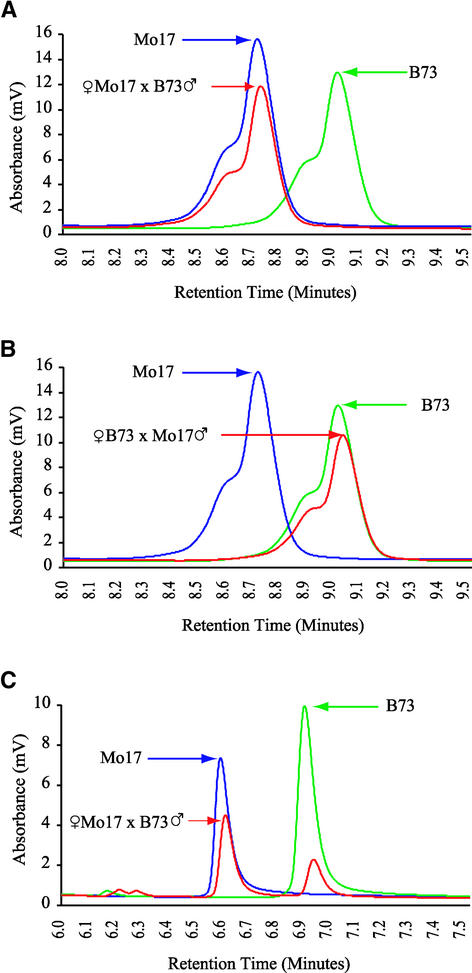
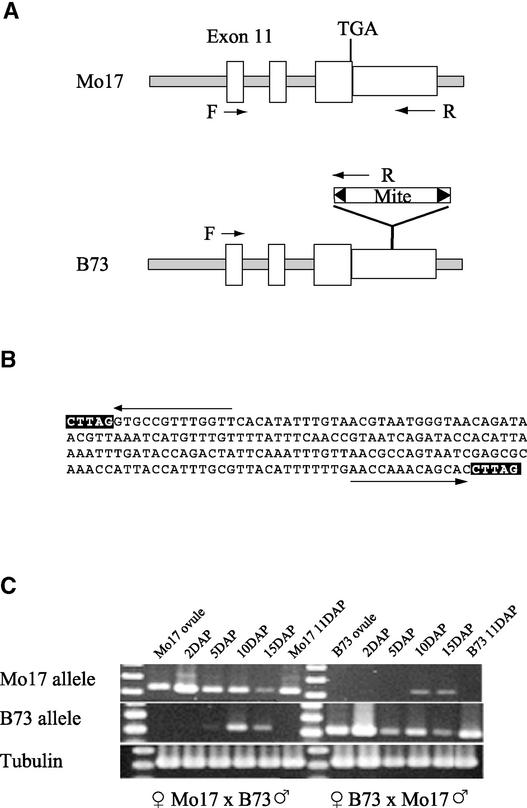
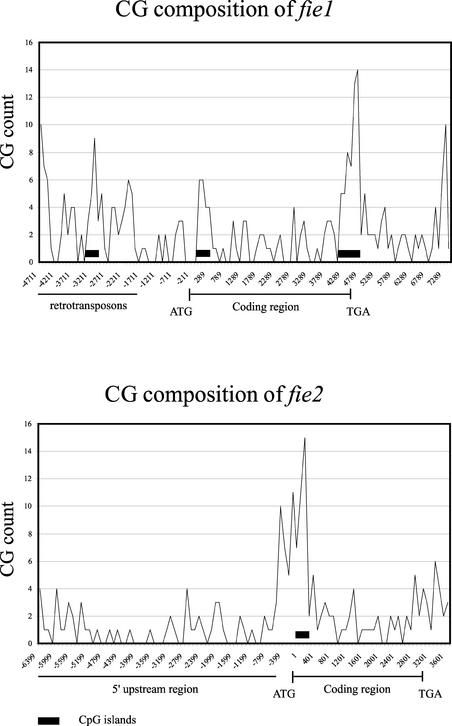
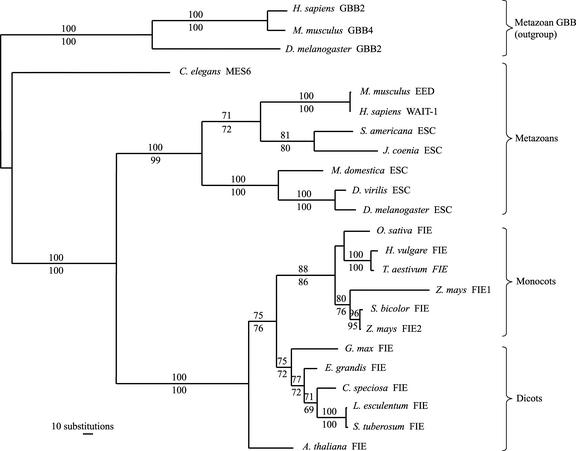
Two maize genes with predicted translational similarity to the Arabidopsis FIE (Fertilization-Independent Endosperm) protein, a repressor of endosperm development in the absence of fertilization, were cloned and analyzed. Genomic sequences of fie1 and fie2 show significant homology within coding regions but none within introns or 5' upstream. The fie1 gene is expressed exclusively in the endosperm of developing kernels starting at approximately 6 days after pollination. fie1 is an imprinted gene showing no detectable expression of the paternally derived fie1 allele during kernel development. Conversely, fie2 is expressed in the embryo sac before pollination. After pollination, its expression persists, predominantly in the embryo and at lower levels in the endosperm. The paternal fie2 allele is not expressed early in kernel development, but its transcription is activated at 5 days after pollination. fie2 is likely to be a functional ortholog of the Arabidopsis FIE gene, whereas fie1 has evolved a distinct function. The maize FIE2 and sorghum FIE proteins form a monophyletic group, sharing a closer relationship to each other than to the FIE1 protein, suggesting that maize fie genes originated from two different ancestral genomes.


Figures

Figure 1.
Figure 1.
Genomic Structure of fie Loci. Genomic segments (12 kb) of fie1 (chromosome 4, bin 4.05) (A) and fie2 (chromosome 10, bin 10.03) (B) are shown. Genes were mapped previously (Springer et al., 2002). The predicted start and stop codons of the fie coding regions are indicated by ATG and TGA, respectively. Positions of nucleotides are relative to the translation start codon ATG (+1). The putative transcription and translation start sites are shown as bent arrows; exons are shown as tall vertical boxes, UTRs as shorter boxes, and introns as thick dark lines. Regions that have homology with retrotransposons are stippled. The direct repeats positioned upstream of fie2 are marked by large arrows. (C) shows a sequence alignment of the A, B, and C repeats. Nucleotide identities are shaded.
Figure 2.
Figure 2.
fie Expression in Developing Kernels. (A) RNA gel blot analysis of mRNA isolated from ovules and kernels at 3, 6, 9, 12, and 15 DAP. A total of 3 μg of poly(A) RNA was loaded in each lane. Blots were probed with 32P-labeled 300-bp specific probes from the 3′ UTR of fie1 or fie2 cDNA (see Methods). Probes have no homology with each other and do not cross-hybridize. The actin probe was used as a loading control. (B) Distribution of the 17-mer tags (5′-GATCTAGTGTGTGGCTG-3′) generated by MPSS from endosperm and embryo mRNAs. The vertical axis represents the frequency of tags as parts per million of molecules sequenced. The horizontal axis represents stages of kernel development starting with unfertilized ovules (point 0) and 8, 12, 21, 25, 35, and 40 DAP. The endosperms and embryos were dissected from kernels at 12 DAP and later stages. Squares and triangles indicate tag numbers in endosperms and embryos, respectively. (C) RT-PCR of fie mRNA in the embryo and the endosperm isolated with a dissecting microscope from 16-DAP kernels. RT-PCR was performed with primers specific for fie1 or fie2. RT-PCR of α-tubulin cDNA was used as a positive control.
Figure 3.
Figure 3.
Detection of fie2 mRNA in Ovules and Kernels by in Situ Hybridization. Longitudinal sections of ovules and kernels at 5 and 15 DAP (inbred line B73) were hybridized with fie2 sense and antisense RNA probes. Signal is brownish red. The sense fie2 RNA probe, which was used as a negative control, did not reveal any signal (data not shown). (A) Ovule at silking (differential interference contrast microscopy image). (B) Embryo in a 5-DAP kernel. (C) Embryo in a 15-DAP kernel. (D) Whole kernel at 15 DAP. EM, embryo; EN, endosperm; ES, embryo sac; N, nucellus; P, pericarp; S, scutellum. Bars = 0.1 mm in (A) to (C) and 1 mm in (D).
Figure 4.
Figure 4.
Paternal and Maternal fie1 mRNA Accumulation in Developing Kernels. Graphs represent the size-dependent separation of RT-PCR amplification products by the WAVE denaturing HPLC system. Larger fragments are retained longer on the DNASEP cartridges, resulting in an accurate quantitative separation of fragments from a complex mixture. Total RNA was isolated from 15-DAP kernels from Mo17 × B73 reciprocal crosses. Unfertilized ovules and 11-DAP kernels from self-pollinated plants were sampled from both inbred lines as controls. Total RNA was extracted from whole kernels, and RT-PCR was performed with primers positioned around a 12-bp deletion in the 3′ UTR of the Mo17 allele. (A) Expression of the maternal Mo17 allele in the Mo17 × B73 cross. (B) Expression of the maternal B73 allele in a reciprocal cross. (C) Biallelic expression of a control gene detected in the same RNA samples. The ratio of maternal to paternal peaks is 2.1:1. RT-PCR primers were designed around an insertion/deletion in the EST sequence MEST80-E04.T3 (courtesy of Mei Guo, Pioneer Hi-Bred International).
Figure 5.
Figure 5.
Patterns of Paternal and Maternal fie2 mRNA Accumulation in Developing Kernels. (A) fie2 Mo17 and B73 alleles are polymorphic as a result of a MITE insertion in the 3′ UTR in B73. Positions of a common forward primer (F) in exon 11 and genotype-specific reverse primers (R) in the 3′ UTR are indicated by arrows. (B) DNA sequence of the 185-bp MITE insertion into the 3′ UTR of the fie2 B73 allele. The target-site duplications are boxed, and arrows mark the 13-bp terminal inverted repeats. (C) Detection of maternal and paternal allele expression in developing kernels from reciprocal crosses. Reciprocal crosses between B73 and Mo17 were performed, and kernels were collected at 2, 5, 10, and 15 DAP. Total RNAs were isolated from whole kernels, including pericarp, and amplified by RT-PCR with the primers shown in (A). Ovules and 11-DAP selfed kernels were used as controls for primer specificity. α-Tubulin RT-PCR was used as a loading control.
Figure 6.
Figure 6.
Distribution of the CG Dinucleotides along fie Genomic Sequences. Peaks represent the number of CG dinucleotides per 100 nucleotides. Start and stop codons are indicated by ATG and TGA, respectively. CpG islands are marked by closed rectangles.
Figure 7.
Figure 7.
Phylogram of Plant and Animal FIE/ESC Proteins. The Branch and Bound algorithm of the PAUP program found a single most parsimonious tree with a total length of 1913 steps. The numbers shown above and below the branches indicate the percentage of times a monophyletic group occurred among 500 bootstrap and jackknife replicates, respectively. Lengths of branches are proportional to the number of inferred amino acid substitutions. Species and protein names and accession numbers are listed in Table 1.

References

    1. Alleman, M., and Doctor, J. (2000). Genomic imprinting in plants: Observation and evolutionary implications. Plant Mol. Biol. 43, 147–161. - PubMed
    1. Altschul, S.F., Madden, T.L., Schaffer, A., Zhang, J., Zhang, Z., Miller, W., and Lipman, D.J. (1997). Gapped BLAST and PSI-BLAST: A new generation of protein database search programs. Nucleic Acids Res. 25, 3389–3402. - PMC - PubMed
    1. Bradley, D., Carpenter, R., Somer, H., Hartley, N., and Coen, E. (1993). Complementary floral homeotic phenotypes result from opposite orientations of a transposon at the plena locus of Antirrhinum. Cell 72, 85–95. - PubMed
    1. Brenner, S., et al. (2000. a). Gene expression analysis by massively parallel signature sequencing (MPSS) on microbead arrays. Nat. Biotechnol. 18, 630–634. - PubMed
    1. Brenner, S., et al. (2000. b). In vitro cloning of complex mixtures of DNA on microbeads: Physical separation of differentially expressed cDNAs. Proc. Natl. Acad. Sci. USA 97, 1665–1670. - PMC - PubMed

MeSH terms

LinkOut - more resources