. 2003 Feb;15(2):439-47.
doi: 10.1105/tpc.009225.

Overexpression of a plasma membrane aquaporin in transgenic tobacco improves plant vigor under favorable growth conditions but not under drought or salt stress

Affiliations

Overexpression of a plasma membrane aquaporin in transgenic tobacco improves plant vigor under favorable growth conditions but not under drought or salt stress

Refael Aharon et al. Plant Cell. 2003 Feb.

Abstract

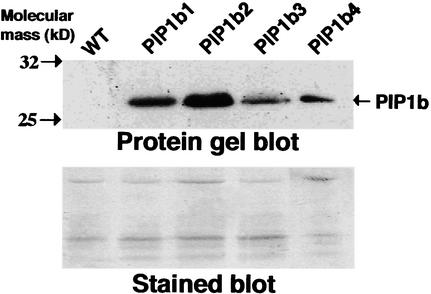
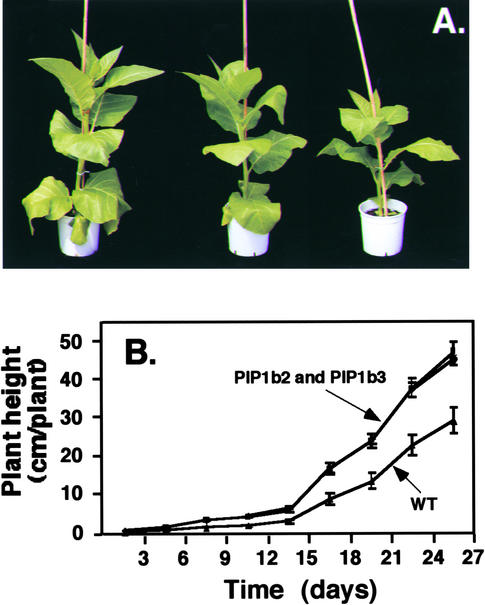
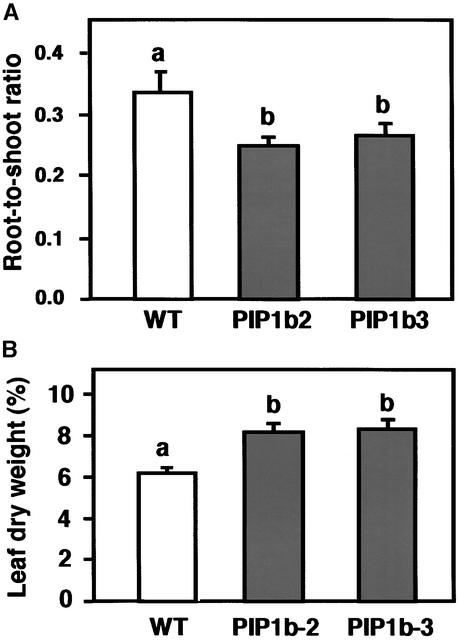
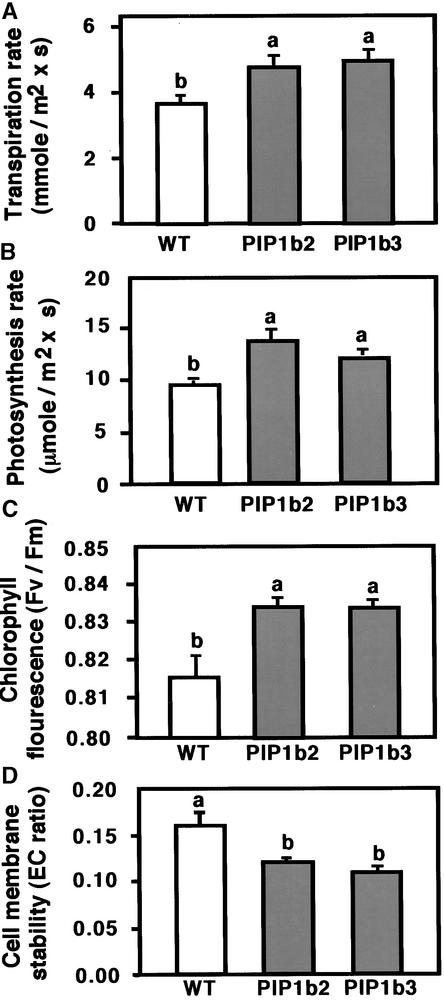
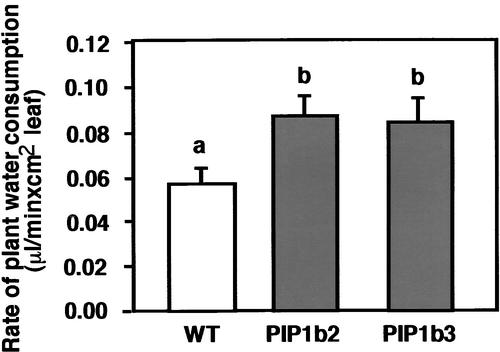
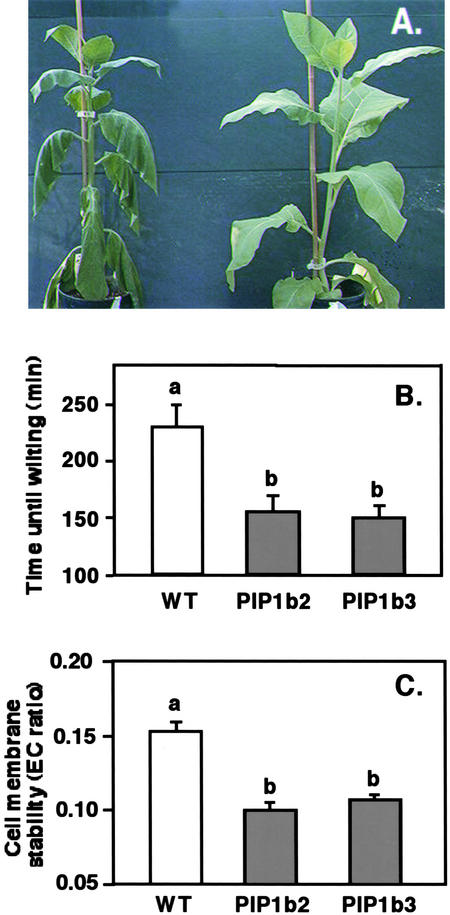
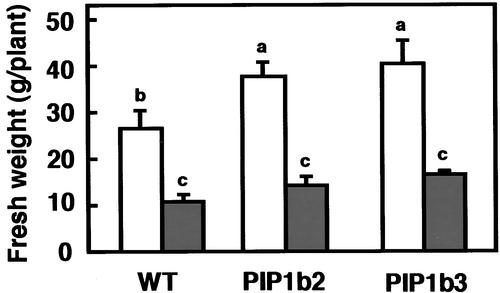
Most of the symplastic water transport in plants occurs via aquaporins, but the extent to which aquaporins contribute to plant water status under favorable growth conditions and abiotic stress is not clear. To address this issue, we constitutively overexpressed the Arabidopsis plasma membrane aquaporin, PIP1b, in transgenic tobacco plants. Under favorable growth conditions, PIP1b overexpression significantly increased plant growth rate, transpiration rate, stomatal density, and photosynthetic efficiency. By contrast, PIP1b overexpression had no beneficial effect under salt stress, whereas during drought stress it had a negative effect, causing faster wilting. Our results suggest that symplastic water transport via plasma membrane aquaporins represents a limiting factor for plant growth and vigor under favorable conditions and that even fully irrigated plants face limited water transportation. By contrast, enhanced symplastic water transport via plasma membrane aquaporins may not have any beneficial effect under salt stress, and it has a deleterious effect during drought stress.


Figures

Figure 1.
Figure 1.
Overexpression of Arabidopsis PIP1b in Transgenic Tobacco Plants. In the gel at top, proteins from membrane-enriched fractions of wild-type (WT) and representative transgenic tobacco plants independently transformed with the chimeric 35S-PIP1b-AU1 gene (PIP1b1 to PIP1b4) were reacted by protein gel blot analysis with monoclonal antibodies raised against the AU1 epitope tag. The migrations of two molecular mass markers and of PIP1b are indicated at left and right, respectively. The gel at bottom shows Coomassie blue staining of the gel at top.
Figure 2.
Figure 2.
Morphology of the PIP1b-Overexpressing Transgenic Tobacco Plants. (A) Phenotypes of 65-day-old wild-type (right) and transgenic PIP1b2 (left) and PIP1b3 (center) plants. (B) Growth rates of wild-type (WT) and transgenic PIP1b2 and PIP1b3 plants. The growth rates of PIP1b2 and PIP1b3 plants were very similar; therefore, their curves overlap. Bars represent the standard error of the mean of at least five plants per genotype.
Figure 3.
Figure 3.
Effects of PIP1b Overexpression on Root/Shoot Ratio and Relative Water Content. (A) The root/shoot mass ratio of wild-type (white column) and transgenic PIP1b2 and PIP1b3 (gray columns) lines grown hydroponically. (B) Dry weight percentage was measured in the first fully exposed leaves of wild-type (white column) and transgenic PIP1b2 and PIP1b3 (gray columns) lines. Bars represent the standard errors of the means of at least five plants per genotype. Different letters above the columns indicate statistically significant differences at the 0.05 level. WT, wild type.
Figure 4.
Figure 4.
Effects of PIP1b Overexpression on Several Physiological Parameters of the Plants. Transpiration rate (A), photosynthesis rate (B), the chlorophyll fluorescence parameter Fv/Fm (C), and cell membrane stability (D) (measured by an EC ratio whose relatively lower values are correlated with better membrane vitality) are shown. Measurements were performed on the first fully exposed leaves of wild-type (white columns) and transgenic PIP1b2 and PIP1b3 (gray columns) lines. Bars represent the standard errors of the means of at least five plants per genotype. Different letters above the columns indicate statistically significant differences at the 0.05 level. WT, wild type.
Figure 5.
Figure 5.
Effect of PIP1b Overexpression on Plant Water Consumption. Water consumption by 30-day-old plants grown hydroponically was analyzed using a microelectronic potometer (R. Aharon, G. Galili, A. Blum, and Y. Kapulnik, unpublished data). The rate of water consumption was measured from the linear water absorption curve and was normalized to units of leaf area. Bars represent the standard errors of the means of at least five plants per genotype. Different letters above the columns indicate statistically significant differences at the 0.05 level. WT, wild type.
Figure 6.
Figure 6.
Response of PIP1b Overexpression to Drought Stress. (A) Wild-type and transgenic PIP1b2 plants were subjected to drought stress as indicated in Methods. A representative PIP1b2 plant (left) and a wild-type plant (right) were photographed on the day the first plant wilted. PIP1b3 plants also wilted significantly earlier than wild-type plants, but no photograph was taken. (B) Time for detached leaves from regularly irrigated wild-type and PIP1b2- and PIP1b3-overexpressing plants to wilt. (C) Cell membrane stability (EC ratio) was analyzed in wild-type and PIP1b2- and PIP1b3-overexpressing plants at the time that detached leaves of the transgenic plants wilted (leaves of wild-type plants had not yet wilted). Bars indicate the standard errors of the means of at least five plants per genotype. Different letters above the columns indicate statistically significant differences at the 0.05 level. WT, wild type.
Figure 7.
Figure 7.
Effect of PIP1b Overexpression on Plant Fresh Weight under Salt Stress. Wild-type and transgenic PIP1b2 and PIP1b3 plants were irrigated for 40 days with either tap water (white columns) or tap water supplemented with 90 mM NaCl (gray columns), and total plant fresh weights were measured. Bars represent the standard errors of the means of at least five plants per genotype. Different letters above the columns indicate statistically significant differences at the 0.05 level. WT, wild type.

References

    1. Agre, P., Sasaki, S., and Chrispeels, M.J. (1993). Aquaporins: A family of water channels proteins. Am. J. Physiol. 265, F461. - PubMed
    1. Amodeo, G., Dorr, R., Vallejo, A., Stuka, M., and Parisi, M. (1999). Radial and axial water transport in the sugar beet storage root. J. Exp. Bot. 50, 509–516.
    1. Berger, D., and Altmann, T. (2000). A subtilisin-like serine protease involved in the regulation of stomatal density and distribution in Arabidopsis thaliana. Genes Dev. 14, 1119–1131. - PMC - PubMed
    1. Blum, A., and Adelina, E. (1979). Cell membrane stability as measure of drought and heat tolerance in wheat. Crop Sci. 21, 43–47.
    1. Blumwald, E. (2000). Sodium transport and salt tolerance in plants. Curr. Opin. Cell Biol. 12, 431–434. - PubMed

Publication types

MeSH terms