. 2003 Feb;15(2):509-22.
doi: 10.1105/tpc.008888.

Role of a single aquaporin isoform in root water uptake

Affiliations

Role of a single aquaporin isoform in root water uptake

Hélène Javot et al. Plant Cell. 2003 Feb.

Abstract

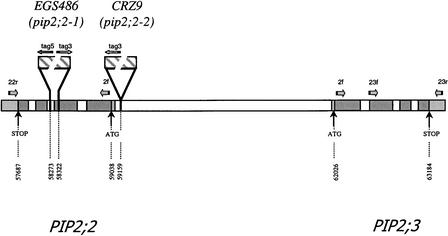
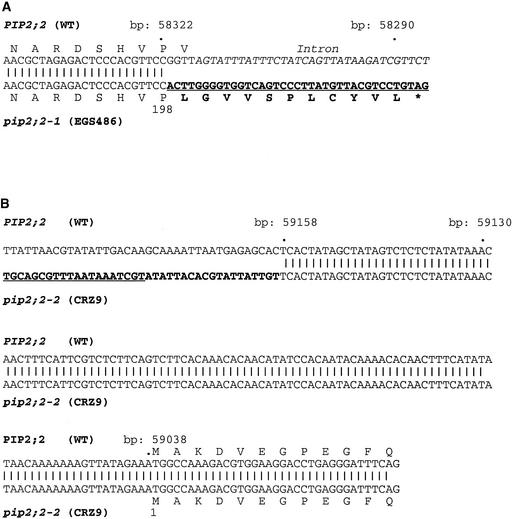
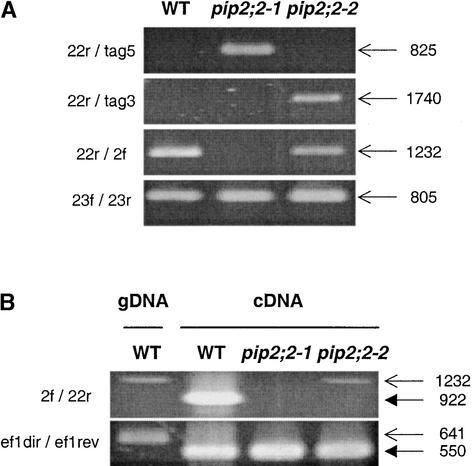
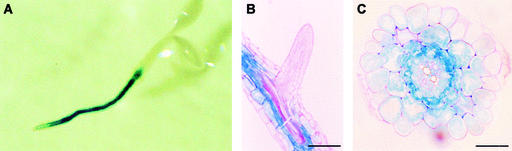
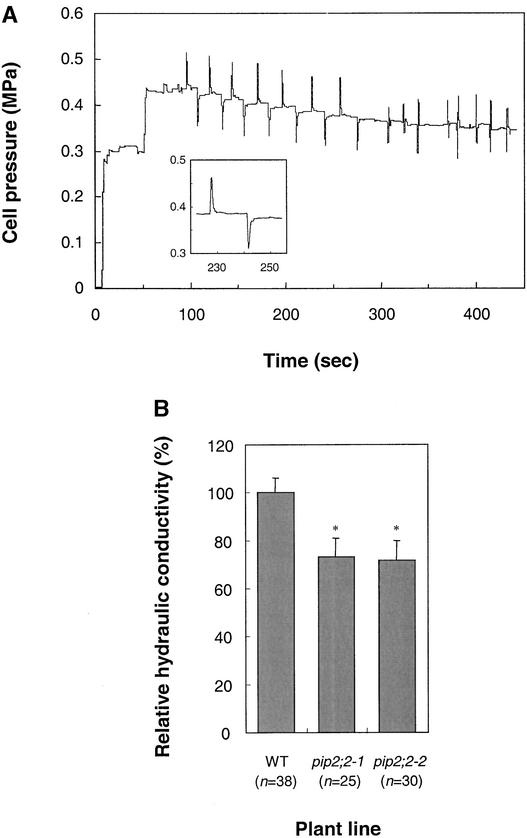
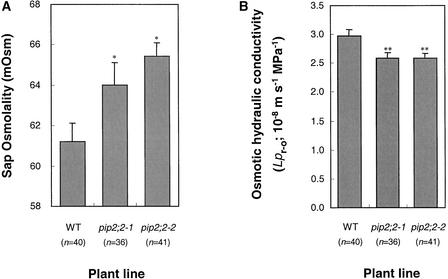
Aquaporins are ubiquitous channel proteins that facilitate the transport of water across cell membranes. Aquaporins show a typically high isoform multiplicity in plants, with 35 homologs in Arabidopsis. The integrated function of plant aquaporins and the function of each individual isoform remain poorly understood. Matrix-assisted laser desorption/ionization time-of-flight analyses suggested that Plasma Membrane Intrinsic Protein2;2 (PIP2;2) is one of the abundantly expressed aquaporin isoforms in Arabidopsis root plasma membranes. Two independent Arabidopsis knockout mutants of PIP2;2 were isolated using a PCR-based strategy from a library of plant lines mutagenized by the insertion of Agrobacterium tumefaciens T-DNA. Expression in transgenic Arabidopsis of a PIP2;2 promoter-beta-glucuronidase gene fusion indicated that PIP2;2 is expressed predominantly in roots, with a strong expression in the cortex, endodermis, and stele. The hydraulic conductivity of root cortex cells, as measured with a cell pressure probe, was reduced by 25 to 30% in the two allelic PIP2;2 mutants compared with the wild type. In addition, free exudation measurements revealed a 14% decrease, with respect to wild-type values, in the osmotic hydraulic conductivity of roots excised from the two PIP2;2 mutants. Together, our data provide evidence for the contribution of a single aquaporin gene to root water uptake and identify PIP2;2 as an aquaporin specialized in osmotic fluid transport. PIP2;2 has a close homolog, PIP2;3, showing 96.8% amino acid identity. The phenotype of PIP2;2 mutants demonstrates that, despite their high homology and isoform multiplicity, plant aquaporins have evolved with nonredundant functions.


Figures

Figure 1.
Figure 1.
Physical Map of the PIP2;2 and PIP2;3 Genes Derived from the Genomic Sequence of the Chromosome. The sizes of the inserted T-DNAs are not presented to scale. Numbers refer to nucleotides in PIP2;2. Horizontal arrows indicate the positions and orientations of primer sequences used for PCR analyses.
Figure 2.
Figure 2.
Sequence Analysis of T-DNA Insertion Sites in Two Arabidopsis PIP2;2 Mutant Lines. Genomic DNA was amplified by PCR from the wild type and the EGS486 and CRZ9 transformed lines using a pair of primers specific for PIP and T-DNA border sequences, respectively. DNA sequences that are divergent from wild-type genomic DNA are indicated in bold type, and specific T-DNA sequences are underlined. Nucleotide numbers refer to those in PIP2;2. The predicted translation products of the wild-type (WT) and mutated PIP2;2 genes are indicated using single-letter code, with residues being numbered with respect to the initiating Met. (A) Sequence analysis in EGS486 (pip2;2-1). The T-DNA sequences shown carry part of the right border signal. The sequence of intron 2 in PIP2;2 is indicated in italics. According to the putative membrane topology of PIPs, the amino acid stretch Asn-192 to Val-200 is located in the second intracellular loop of PIP2;2. Note that if translated, the EGS486 mRNA may lead to a truncated protein of 209 amino acids comprising the first 198 residues of PIP2;2 (wild-type PIP2;2 has 285 residues) plus 11 T-DNA–encoded residues. (B) Sequence analysis in CRZ9 (pip2;2-2). The DNA sequence that reads outside from the T-DNA toward the right border signal is underlined. The remaining 19-bp foreign sequence is of unknown origin and was generated during T-DNA insertion. The insertion occurred at 121 bp upstream of the ATG, downstream of nucleotide 59,158.
Figure 3.
Figure 3.
PCR Analysis of the Genomic Structure and mRNA Expression of PIP2;2 in Wild-Type and Two Arabidopsis PIP2;2 Mutant Lines. (A) Agarose gel separation of PCR products amplified from the genomic DNA of the wild type (WT), pip2;2-1, and pip2;2-2. The primer combinations used are indicated at left. The positions of the primers on the physical map of PIP2;2 and PIP2;3 are shown in Figure 1. The sizes (in bp) and calculated migrations (arrows) of the predicted PCR products are shown at right. (B) Agarose gel separation of PCR products amplified from genomic DNA (gDNA) of the wild type and cDNA of the wild type, pip2;2-1, and pip2;2-2. The expression of Elongation Factor1α (primer combination ef1dir/ef1rev) is shown as a control. The sizes and calculated migrations of the PCR products predicted for amplification from gDNA and cDNA are shown by the top and bottom arrows in each gel, respectively. Amplification of gDNA products in the cDNA reactions is attributable to the presence of traces of gDNA (total RNA was not treated by RQ1 DNase). This establishes that the PCR conditions were suitable for the primer combinations used.
Figure 4.
Figure 4.
Expression Analysis of a PIP2;2-GUS Construct in Transgenic Arabidopsis. (A) GUS staining of a 3-day-old seedling grown in vitro. (B) Longitudinal section of a GUS-stained root from a 29-day-old plant grown in hydroponic conditions. Bar = 100 μm. (C) Cross-section at 3 to 4 mm from the tip of a root of a 29-day-old plant grown in hydroponic conditions. Note that GUS staining was most intense in the endodermis and in the few outer cell layers of the stele. Bar = 25 μm.
Figure 5.
Figure 5.
Cell Pressure Probe Measurements in the Cortex Cells of Arabidopsis Roots. (A) Typical recording trace of turgor pressure in a wild-type root. The first stationary pressure measured after penetration of the pipette into the root tissue corresponds to the impalement of an epidermal cell. Upon displacement of the pipette deeper into the root (at ∼50 s), a higher stationary turgor pressure (Pe) was measured in an adjacent cortical cell. After stabilization of the cell pressure, a rapid increase or decrease in cell volume can be imposed using the pressure probe, resulting in exosmotic (outward) or endosmotic (inward) water movements, respectively. The associated pressure relaxations were used to deduce the t1/2. On the right side of the recording (>300 s), quick changes in pressure were imposed and reverted before any significant pressure-induced water flow had occurred. These maneuvers allow the determination of the cell volumetric elastic modulus (ɛ). The inset shows a detail of the results from a hydrostatic experiment showing two opposite pressure relaxations. Mean water relations parameters deduced from the present recording are as follows: Pe = 0.40 ± 0.06 MPa; t1/2 = 0.40 ± 0.02 s; ɛ = 1.66 ± 0.06 MPa; calculated Lpcell = 4.34 × 10⁻⁶ m·s−1·MPa−1. (B) Relative Lpcell from wild-type (WT) and PIP2;2 mutants. The raw data obtained from the indicated number of individual cells and compiled from measurements on three sets of independently grown plants are shown in Table 2. Because of slight variations in absolute
Figure 6.
Figure 6.
Osmotic Water Transport in Roots of the Wild Type and PIP2;2 Mutants. Data were pooled from measurements on three sets of independently grown plants, and the numbers of individual plants tested (n) are indicated in parentheses. (A) Osmolality of sap exuded from roots of wild-type (WT), pip2;2-1, and pip2;2-2 plants. Asterisks indicate values that are statistically different from control wild-type values: pip2;2-1, P = 0.027; pip2;2-2, P = 0.003. (B) Deduced osmotic hydraulic conductivity of roots (Lpr-o) of wild-type, pip2;2-1, and pip2;2-2 plants. Double asterisks indicate values that are statistically different from control wild-type values: pip2;2-1, P = 0.002; pip2;2-2, P = 0.006.

References

    1. Agre, P. (1998). Aquaporin null phenotypes: The importance of classical physiology. Proc. Natl. Acad. Sci. USA 95, 9061–9063. - PMC - PubMed
    1. Agre, P., Bonhivers, M., and Borgnia, M.J. (1998). The aquaporins, blueprints for cellular plumbing systems. J. Biol. Chem. 273, 14659–14662. - PubMed
    1. Axelos, M., Bardet, C., Liboz, T., Le Van Thai, A., Curie, C., and Lescure, B. (1989). The gene family encoding the Arabidopsis thaliana translation elongation factor EF-1α: Molecular cloning, characterization and expression. Mol. Gen. Genet. 219, 106–112. - PubMed
    1. Barrieu, F., Morillon, R., and Chrispeels, M. (2000). Modulation of aquaporin gene expression in Arabidopsis leads to altered membrane water permeability. In Molecular Biology and Physiology of Water and Solute Transport, S. Hohmann and S. Nielsen, eds (New York: Kluwer Academic/Plenum Publishers), pp. 255–259.
    1. Bechtold, N., Ellis, J., and Pelletier, G. (1993). In planta Agrobacterium-mediated gene transfer by infiltration of adult Arabidopsis thaliana plants. C. R. Acad. Sci. Paris 316, 1194–1199.

Publication types

MeSH terms