

Growth of a Dehalococcoides-like microorganism on vinyl chloride and cis-dichloroethene as electron acceptors as determined by competitive PCR
- PMID: 12571017
- PMCID: PMC143607
- DOI: 10.1128/AEM.69.2.953-959.2003
Growth of a Dehalococcoides-like microorganism on vinyl chloride and cis-dichloroethene as electron acceptors as determined by competitive PCR
Erratum in
- Appl Environ Microbiol. 2003 Jul;69(7):4342
Abstract
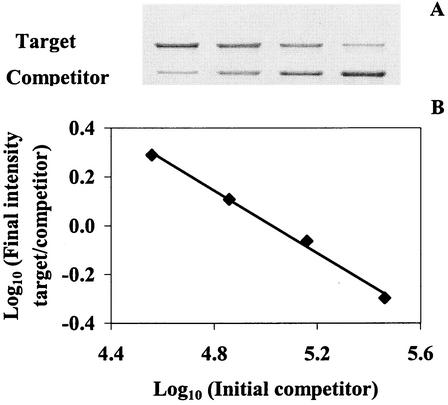
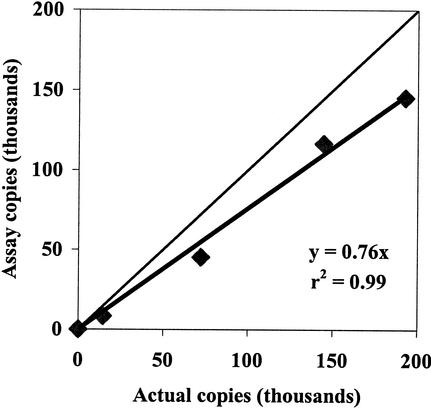
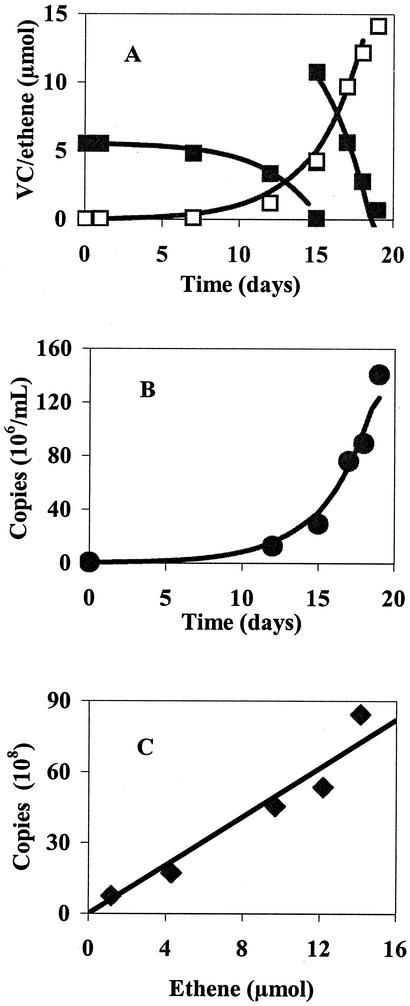
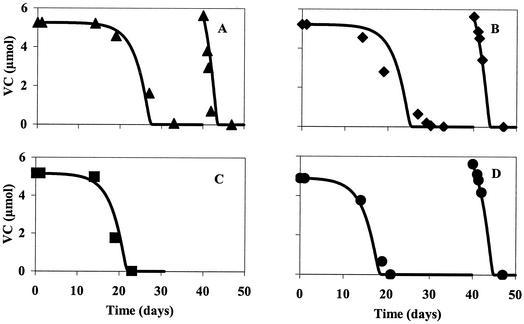
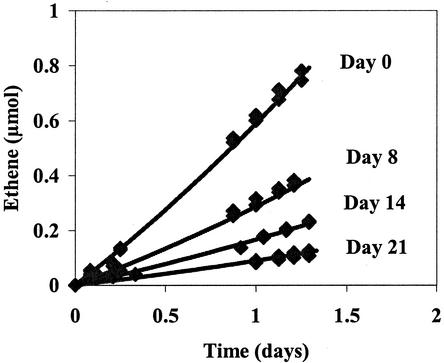
A competitive PCR (cPCR) assay targeting 16S ribosomal DNA was developed to enumerate growth of a Dehalococcoides-like microorganism, bacterium VS, from a mixed culture catalyzing the reductive dehalogenation of cis-1,2-dichloroethene (cDCE) and vinyl chloride (VC), with hydrogen being used as an electron donor. The growth of bacterium VS was found to be coupled to the dehalogenation of VC and cDCE, suggesting unique metabolic capabilities. The average growth yield was (5.2 +/- 1.5) x 10(8) copies of the 16S rRNA gene/ micromol of Cl(-) (number of samples, 10), with VC being used as the electron acceptor and hydrogen as the electron donor. The maximum VC utilization rate (q) was determined to be 7.8 x 10(-10) micromol of Cl(-) (copy(-1) day(-1)), indicating a maximum growth rate of 0.4 day(-1). These average growth yield and q values agree well with values found previously for dechlorinating cultures. Decay coefficients were determined with growth (0.05 day(-1)) and no-growth (0.09 day(-1)) conditions. An important limitation of this cPCR assay was its inability to discriminate between active and inactive cells. This is an essential consideration for kinetic studies.
Figures
References
-
- Adrian, L., U. Szewzyk, J. Wecke, and H. Görisch. 2000. Bacterial dehalorespiration with chlorinated benzenes. Science 408:580-583. - PubMed
-
- Altschul, S. F., W. Gish, W. Miller, E. W. Myers, and D. J. Lipman. 1990. Basic local alignment search tool. J. Mol. Biol. 215:403-410. - PubMed
-
- Baek, J.-M., and C. M. Kenerley. 1998. Detection and enumeration of a genetically modified fungus in soil environments by quantitative competitive polymerase chain reaction. FEMS Microbiol. Ecol. 25:419-428.
-
- Chandler, D. P. 1998. Redefining relativity: quantitative PCR at low template concentrations for industrial and environmental microbiology. J. Ind. Microbiol. Biotechnol. 21:128-140.
Publication types
MeSH terms
Substances
LinkOut - more resources
Full Text Sources
Other Literature Sources
Molecular Biology Databases
