. 2003 Feb 18;100(4):1519-23.
doi: 10.1073/pnas.0436708100. Epub 2003 Feb 5.

Long-term regional suppression of pink bollworm by Bacillus thuringiensis cotton

Affiliations

Long-term regional suppression of pink bollworm by Bacillus thuringiensis cotton

Yves Carrière et al. Proc Natl Acad Sci U S A. .

Abstract

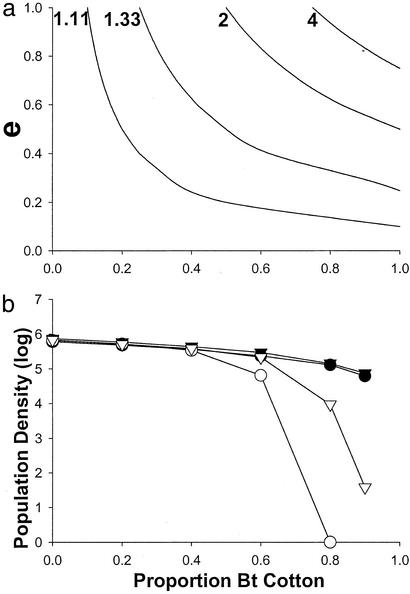
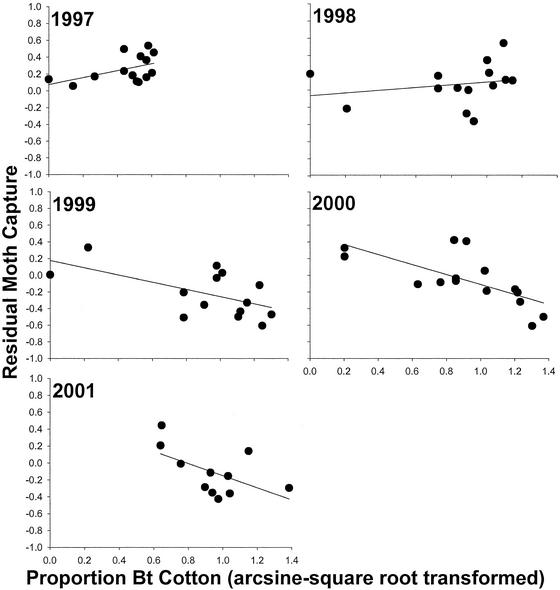
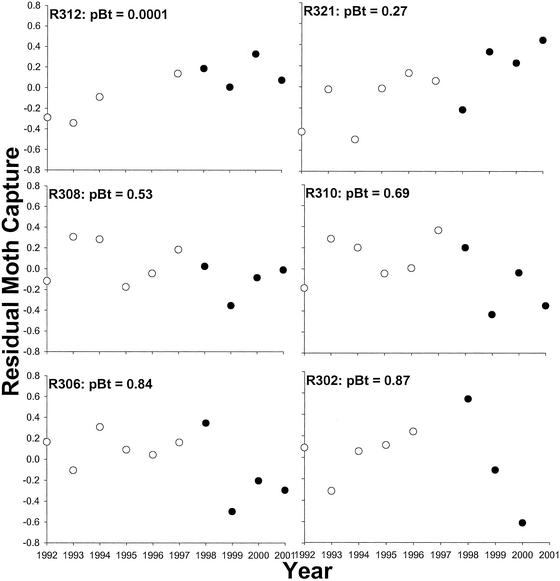
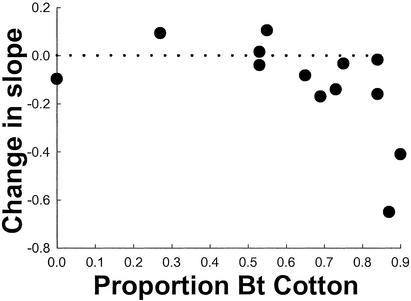
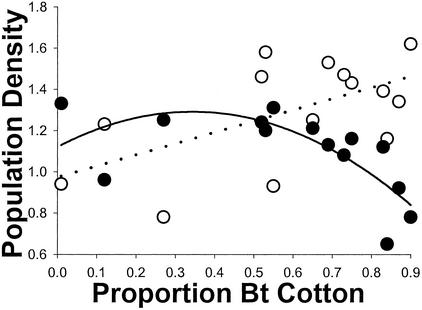
Despite the potentially profound impact of genetically modified crops on agriculture and the environment, we know little about their long-term effects. Transgenic crops that produce toxins from Bacillus thuringiensis (Bt) to control insects are grown widely, but rapid evolution of resistance by pests could nullify their benefits. Here, we present theoretical analyses showing that long-term suppression of pest populations is governed by interactions among reproductive rate, dispersal propensity, and regional abundance of a Bt crop. Supporting this theory, a 10-year study in 15 regions across Arizona shows that Bt cotton suppressed a major pest, pink bollworm (Pectinophora gossypiella), independent of demographic effects of weather and variation among regions. Pink bollworm population density declined only in regions where Bt cotton was abundant. Such long-term suppression has not been observed with insecticide sprays, showing that transgenic crops open new avenues for pest control. The debate about putative benefits of Bt crops has focused primarily on short-term decreases in insecticide use. The present findings suggest that long-term regional pest suppression after deployment of Bt crops may also contribute to reducing the need for insecticide sprays.


Figures

Figure 1
Figure 1
Effect of Bt crop abundance on population density in a deterministic (a) and spatially explicit, stochastic (b) model. (a) Density decreases at values of emigration (e) and proportion of Bt cotton above and to the right of the curves associated with each value of Ro (net reproductive rate). Ro values are shown to the left of each curve. For example, with Ro = 1.11 and e = 0.2, density decreases if proportion of Bt cotton exceeds 0.5 (Eq. 5). (b) Density 3 years after deployment of Bt cotton. Declines in density were associated with reductions in insecticide sprays. F represents female daily fecundity and e represents adult emigration rate from natal fields. With e = 0.1, 10% of the moths emigrated mainly to contiguous fields. With e = 0.9, 90% of the moths dispersed up to four fields away. Symbols represent average population density for two simulations. Filled circles: F = 8, e = 0.1; open circles: F = 8, e = 0.9; filled triangles: F = 12, e = 0.1; open triangles: F = 12, e = 0.9.
Figure 2
Figure 2
Linear regression between regional proportion of Bt cotton (arcsine square root transformed) in a year and residual moth capture (see text) in the next year. Fewer than 15 regions were included in all years except 2000, because <10 pheromone traps had valid data in at least one of the regions. No data on cotton use in 2000 were available for the two regions with the lowest abundance of Bt cotton. Slopes and associated P values from 1997 to 2001 are, respectively: 0.41, P = 0.086; 0.16, P = 0.45; −0.43, P = 0.027; −0.60, P = 0.0037; and −0.71, P = 0.072.
Figure 3
Figure 3
Association between residual moth capture (see text) and year for six representative regions. Average proportion of Bt cotton from 1997 to 2000 (pBt) is shown for each region. Open and filled symbols, respectively, represent years before and after initiation of reductions in population growth (see text).
Figure 4
Figure 4
Association between regional proportion of Bt cotton (pBt as in Fig. 3) and change in population growth. The dotted line indicates no demographic effect of Bt cotton. A negative change in slope denotes a regional decline in population growth (see text). Two regions were excluded because they had fewer than three residuals in the period before or after initiation of reductions in population growth (Fig. 2). The significant quadratic term (coefficient of quadratic term = −0.00016, t = −2.67, P = 0.024; linear term = −0.0075, t = −3.51, P = 0.0057) shows that a reduction in population growth occurred only in regions where Bt cotton was abundant.
Figure 5
Figure 5
Association between regional proportion of Bt cotton (pBt as in Fig. 3) and average regional spring density before and after use of Bt cotton. One region was excluded because we had no estimate of its density before 1997. Average regional proportion of Bt cotton from 1997 to 2000 was positively associated with average regional spring density between 1992 and 1995 (log transformed, open circles, dotted line, slope = 0.0054, t = 2.53, P = 0.027) and negatively associated with average regional spring density between 1999 and 2001 (log transformed, filled circles, solid line, linear term = −0.0071, t = −3.40. P = 0.0059 and quadratic term = – 0.00014, t = −2.35, P = 0.038).

References

    1. James C. International Service for the Acquisition of Agri-biotech Applications (ISAAA) Brief No. 24. Ithaca, NY: ISAAA; 2002.
    1. Roush R T. In: Biotechnology and Integrated Pest Management. Persley G J, editor. Oxon, U.K.: Cab International; 1996. pp. 242–263.
    1. Tabashnik B E, Patin A L, Dennehy T J, Liu Y-B, Carrière Y, Sims M A, Antilla L. Proc Natl Acad Sci USA. 2000;97:12980–12984. - PMC - PubMed
    1. Carrière Y, Tabashnik B E. Proc R Soc London Ser B. 2001;268:1475–1480. - PMC - PubMed
    1. Onstad D W, Guse C A, Spencer J L, Levine E, Gray M E. J Econ Entomol. 2001;94:529–540. - PubMed

Publication types

LinkOut - more resources