. 2003 Feb 18;100(4):1972-7.
doi: 10.1073/pnas.0435906100. Epub 2003 Feb 5.

Cell transfection in vitro and in vivo with nontoxic TAT peptide-liposome-DNA complexes

Affiliations

Cell transfection in vitro and in vivo with nontoxic TAT peptide-liposome-DNA complexes

Vladimir P Torchilin et al. Proc Natl Acad Sci U S A. .

Abstract

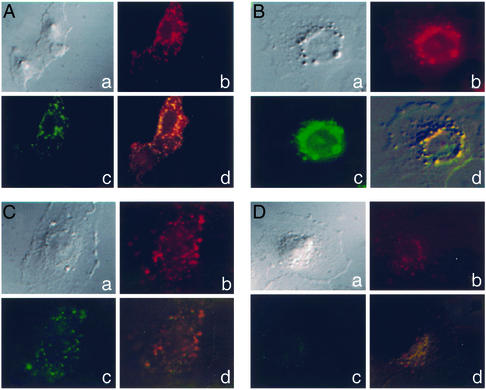
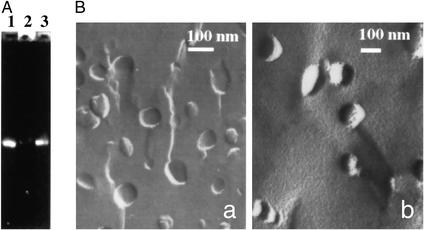
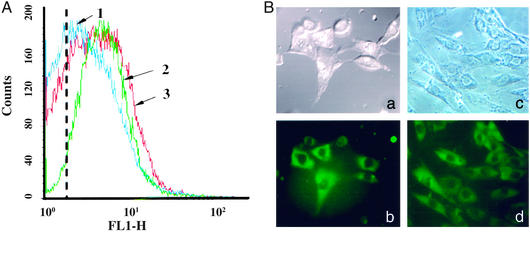
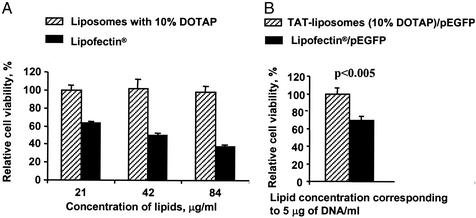
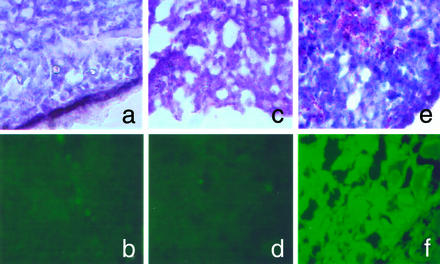
Liposomes modified with TAT peptide (TATp-liposomes) showed fast and efficient translocation into the cell cytoplasm with subsequent migration into the perinuclear zone. TATp-liposomes containing a small quantity (<or=10 mol %) of a cationic lipid formed firm noncovalent complexes with DNA. Here, we present results demonstrating both in vitro and in vivo transfection with TATp-liposome-DNA complexes. Mouse NIH/3T3 fibroblasts and rat H9C2 cardiomyocytes were transfected with such complexes in vitro. The transfection with the TATp-liposome-associated pEGFP-N1 plasmid encoding for the green fluorescent protein (GFP) was high, whereas the cytotoxicity was lower than that of commonly used cationic lipid-based gene-delivery systems. Intratumoral injection of TATp-liposome-DNA complexes into the Lewis lung carcinoma tumor of mice also resulted in an expression of GFP in tumor cells. This transfection system should be useful for various protocols of cell treatment in vitro or ex vivo as well as for localized in vivo gene therapy.


Figures

Figure 1
Figure 1
Intracellular trafficking of Rh-PE-labeled and FITC-dextran-loaded TATp-liposomes within BT20 cells. Typical patterns of intracellular localization and integrity of TATp-liposome after 1 (A), 2 (B), 4 (C), and 9 h (D). a, DIC light; b, DIC with an Rh filter; c, DIC with an FITC filter; d, DIC composite of ac. (Magnification, ×400.) For other conditions, see Materials and Methods.
Figure 2
Figure 2
(A) Gel-electrophoresis results of free pEGFP-N1 plasmid (lane 1), TATp-liposome–pEGFP-N1 complex (lane 2), and Triton X-100-treated TATp-liposome–pEGFP complex (lane 3). (B) Freeze-etching electron microscopy of TATp-liposomes (a) and TATp-liposome–pEGFP-N1 complex (b). For details, see Materials and Methods.
Figure 3
Figure 3
Cell transfection in vitro with TATp-liposome–pEGFP-N1 complexes and TATp-free liposome–pEGFP-N1 complexes. (For detailed conditions, see Materials and Methods.) (A) Flow-cytometry data (the number of fluorescent cells and fluorescence intensity on the FITC channel, FL1-H, after 72 h) for NIH/3T3 cells. 1, fluorescence of cells treated with TATp-free liposome–pEGFP-N1 complex; 2, fluorescence of cells treated with an equal quantity (as DNA and lipids) of Lipofectin–pEGFP complex; 3, fluorescence of cells treated with an equal quantity (as DNA and lipids) of TATp-liposome–pEGFP complex. The dotted line shows the position of the peak autofluorescence of nontreated cells (negative control). (B) The microscopy (×400, after 72 h) of NIH/3T3 (a and b) and H9C2 (c and d) cells treated with TATp-liposome–pEGFP-N1 complex. (a and c) Bright-field light microscopy. (b and d) Epifluorescence microscopy with an FITC filter.
Figure 4
Figure 4
Cytotoxicity test. (A) Comparative cytotoxicity of low-cationic TATp-liposomes and Lipofectin toward NIH/3T3 cells at different lipid concentrations. Incubation for 24 h: Cell viability in the presence of 21 μg/ml TATp-liposomes was taken as 100%. (B) Relative viability of NIH/3T3 cells treated with equal quantities (as DNA, at 5 μg) of TATp-liposome–pEGFP-N1 complex and Lipofectin–pEGFP-N1 lipoplex. Incubation for 4 h: Cell viability in the presence of TATp-liposome–plasmid complex was taken as 100%. For details, see Materials and Methods.
Figure 5
Figure 5
In vivo transfection with TATp-liposome–pEGFP-N1 complex. The microscopy (×400) of frozen tissue sections from in vivo-growing LLC tumors in mice is shown. (a and b) Section from a nontreated tumor (background pattern). (c and d) Section from the tumor injected with TATp-free liposome–pEGFP-N1 complex. (e and f) Section from the tumor injected with TATp-liposome–pEGFP-N1 complex. (a, c, and e) Bright-field light microscopy after hematoxylin/eosin staining. (b, d, and f) Epifluorescence microscopy with FITC filter. For details, see Materials and Methods.

References

    1. McCormic F. Nat Rev Cancer. 2001;1:130–141. - PubMed
    1. Searle P F, Spiers I, Simpson J, James N D. Drug Delivery Syst Sci. 2002;1:5–13.
    1. Chang L J, He J. Curr Opin Mol Ther. 2001;3:468–475. - PubMed
    1. Buchschacher G L, Jr, Wong-Staal F. Hum Gene Ther. 2001;12:1013–1019. - PubMed
    1. Dornburg R, Pomerantz R J. Adv Pharmacol. 2000;49:229–261. - PubMed

LinkOut - more resources