. 2003 Feb 17;22(4):859-69.
doi: 10.1093/emboj/cdg087.

Mechanism of the spatio-temporal regulation of Ras and Rap1

Affiliations

Mechanism of the spatio-temporal regulation of Ras and Rap1

Yusuke Ohba et al. EMBO J. .

Abstract

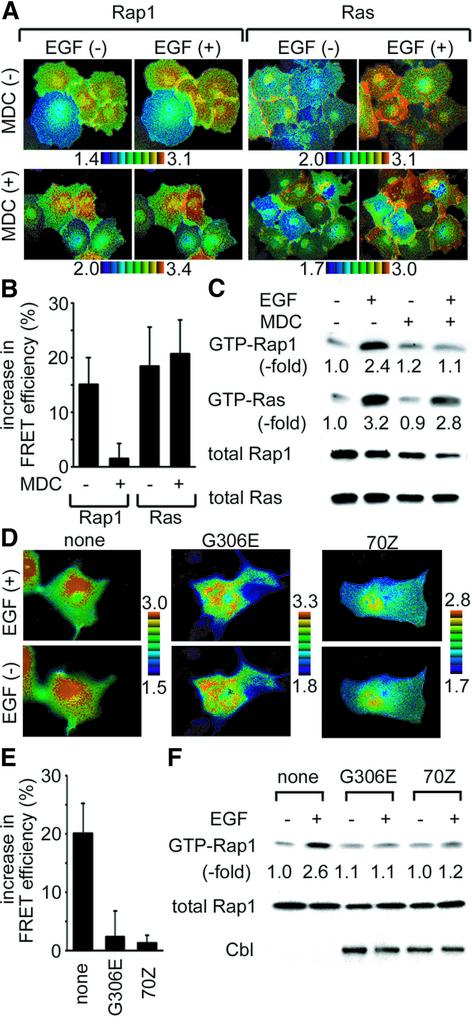
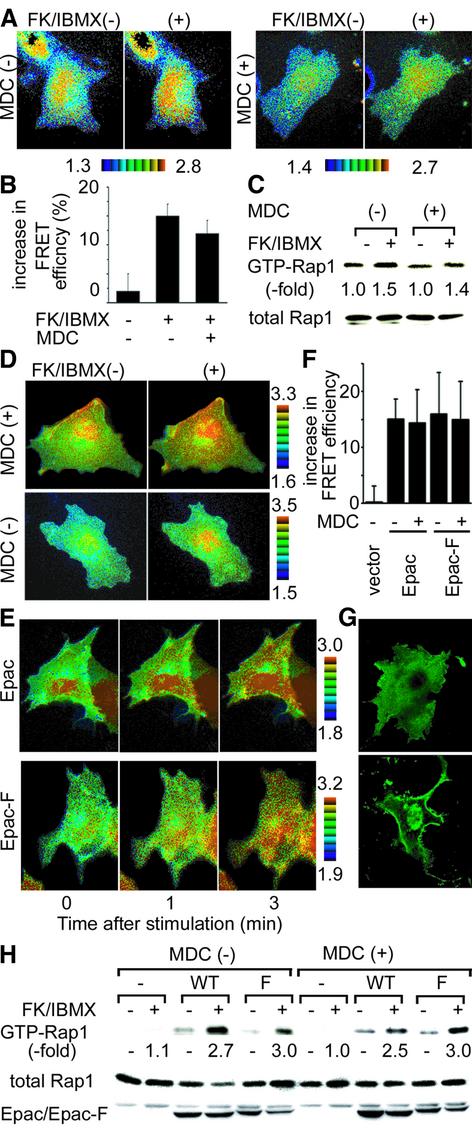
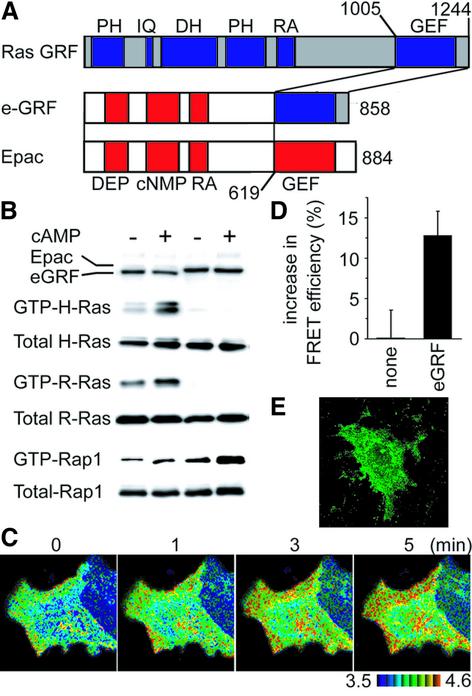
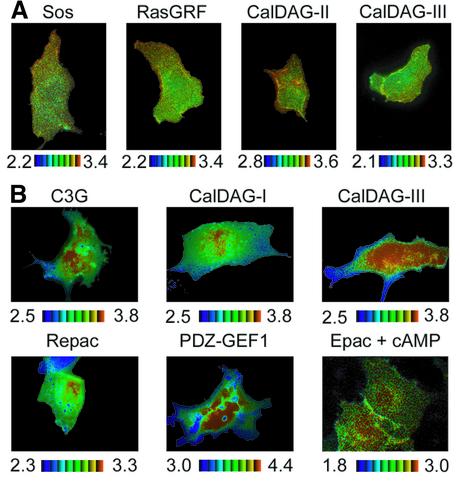
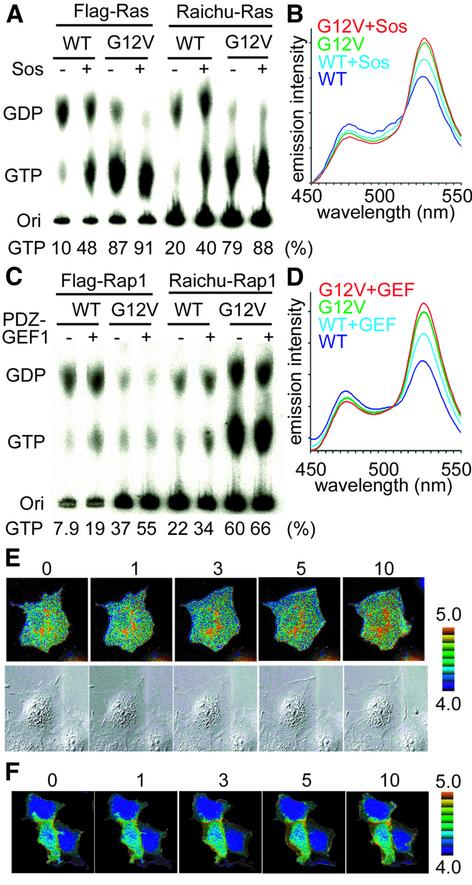
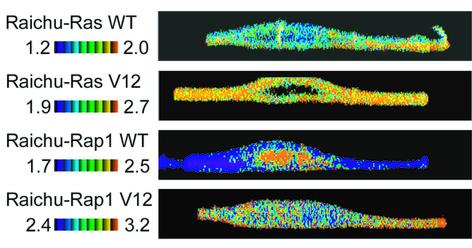
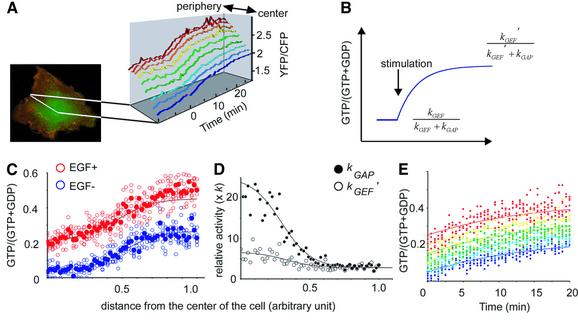
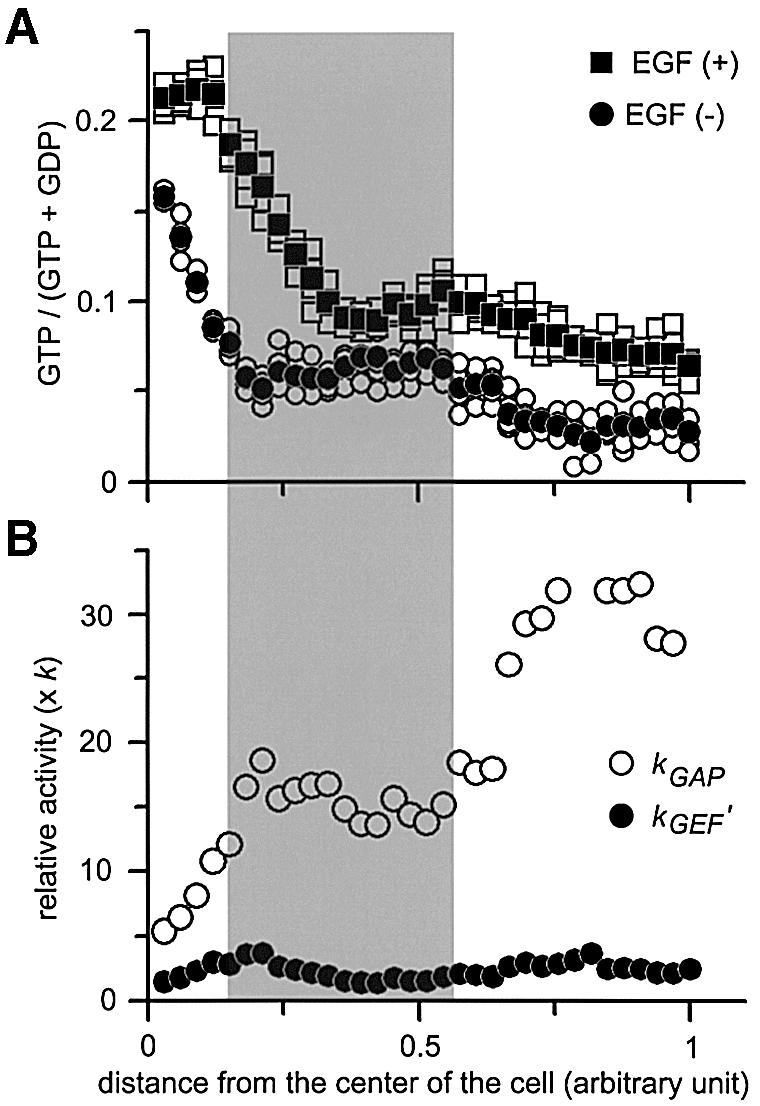
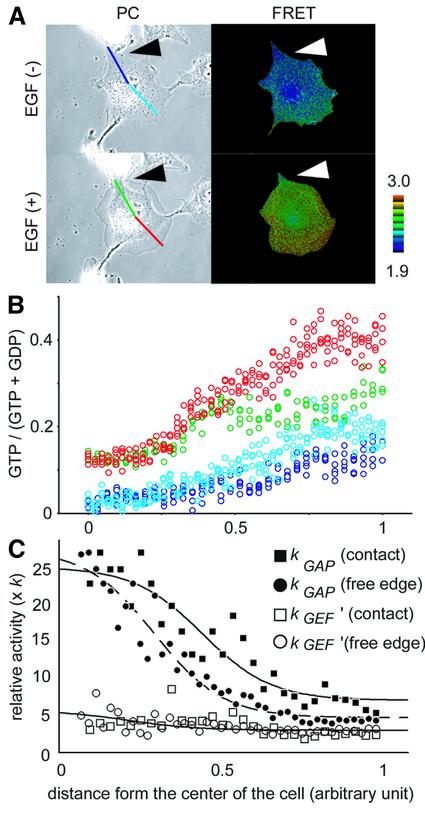
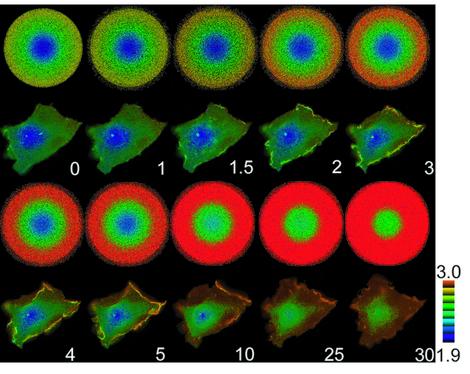
Epidermal growth factor (EGF) activates Ras and Rap1 at distinct intracellular regions. Here, we explored the mechanism underlying this phenomenon. We originally noticed that in cells expressing Epac, a cAMP-dependent Rap1 GEF (guanine nucleotide exchange factor), cAMP activated Rap1 at the perinuclear region, as did EGF. However, in cells expressing e-GRF, a recombinant cAMP-responsive Ras GEF, cAMP activated Ras at the peripheral plasma membrane. Based on the uniform cytoplasmic expression of Epac and e-GRF, GEF did not appear to account for the non-uniform increase in the activities of Ras and Rap1. In contrast, when we used probes with reduced sensitivity to GTPase-activating proteins (GAPs), both Ras and Rap1 appeared to be activated uniformly in the EGF-stimulated cells. Furthermore, we calculated the local rate constants of GEFs and GAPs from the video images of Ras activation and found that GAP activity was higher at the central plasma membrane than the periphery. Thus we propose that GAP primarily dictates the spatial regulation of Ras family G proteins, whereas GEF primarily determines the timing of Ras activation.


Figures

None
Fig. 1. Requirement for endocytosis for EGF-dependent activation of Rap1. (A) Cos-1 cells were transfected with pRaichu-Ras or pRaichu-Rap1. After 24 h, the cells were serum starved for 4 h, treated with MDC or left untreated, and stimulated with 50 ng/ml EGF for 5 min. Images of YFP and CFP were collected by means of an inverted microscope equipped with a cooled CCD camera. A ratio image of YFP/CFP was created to represent FRET efficiency. In the IMD mode shown here, eight colors from red to blue are used to represent the YFP/CFP ratio, with the intensity of each color indicating the mean intensity of YFP and CFP as indicated at the bottom of the photographs. The upper and lower limits of the ratio range are shown at the bottom. (B) Cos-1 cells prepared as in (A) were imaged and YFP/CFP emission ratios were obtained. Average values of fold increase in emission ratio after versus before stimulation of 10 cells are shown with standard deviation. (C) Cos-1 cells treated as in (A) were lysed in lysis buffer, clarified by centrifugation and analyzed by the pull-down method to detect active Ras and Rap1. (D) Cos-1 cells were transfected with pRaichu-Rap1 and with empty vectors (none), expression vectors for Cbl-G306E (G306E), or that for Cbl-70Z (70Z). After 24 h, the cells were serum starved and stimulated with 50 ng/ml EGF for 5 min. FRET images are displayed as in (A). (E) Cos-1 cells prepared as in (D), and quantitated as in (B). (F) Cos-1 cells treated as in (D) were analyzed by the pull-down method to detect the active Rap1. Aliquots of cell lysates were used to determined the expression level of Cbl by using anti-HA antibody.
None
Fig. 2. cAMP-dependent activation of Rap1. (A) Rat1a cells were transfected with pRaichu-Rap1, serum starved for 4 h, treated with MDC or left untreated, and stimulated with 50 µM forskolin (FK) and 100 µM IBMX for 5 min. Cell images were taken as in Figure 1. (B) Rat1a cells treated as in (A) were quantitated as in Figure 1B. (C) Rat1a cells prepared as in (A) were analyzed by the pull-down method. (D) Cos-1 cells were transfected with pRaichu-Rap1 and pIRM21-Flag-Epac. After 24 h, the cells were serum starved, treated with MDC or left untreated, and stimulated with FK and IBMX. FRET images were taken as in Figure 1. (E) Cos-1 cells were transfected with pRaichu-Rap1 and pIRM21-Flag-Epac, or with pRaichu-Rap1 and Epac-F. After 24 h, the cells were serum starved and stimulated with FK and IBMX. Ratio images were created at the time indicated at the bottom of each panel. (F) Cos-1 cells prepared as in (D) and (E) were quantitated as in (B). (G) Cos-1 cells expressing Epac and Epac-F were fixed with paraformaldehyde, permeabilized with Triton X-100 and immunostained with anti-Flag monoclonal antibody, followed by incubation with Alexa488-conjugated goat anti-mouse antibody. The cells were imaged with a confocal microscope. (H) Cos-1 cells prepared as in (D) and (E) were analyzed by the pull-down method. Aliquots of cell lysates were analyzed for the expression of Epac and Epac-F by using anti-Flag antibody.
None
Fig. 3. cAMP-dependent activation of Ras. (A) Schematic illustration of Ras GRF, Epac and a chimera named e-GRF. PH, pleckstrin homology domain; IQ, IQ motif; DH, Dbl homology domain; RA, Ras-associating domain; GEF, GEF catalytic (CDC25 homology) domain; DEP, domains that occur in Dishevelled, Egl-10 and pleckstrin; cNMP, cyclic nucleotide monophosphate-binding motif. (B) 293T cells were transfected with expression plasmids for G proteins with or without those for GEFs as indicated at the top and on the left. After 24 h, the cells were serum starved for 4 h, stimulated by the cAMP analog, Sp-cAMPS triethylamine (cAMP), and the GTP-bound form of the respective G proteins was detected by the pull-down method. (C) Cos-1 cells expressing Raichu-Ras and e-GRF were stimulated and imaged as in Figure 2B. (D) Cos-1 cells prepared as in (C) were quantitated as in Figure 2B. (E) Cos-1 cells expressing Flag-tagged e-GRF were immunostained as in Figure 2G. Cos-1 cells expressing Raichu-Ras and e-GRF were stimulated and imaged as in Figure 2B.
None
Fig. 4. Ras and Rap1 activation by various GEFs. Cos-1 cells were transfected with pRaichu-Ras (A) and pRaichu-Rap1 (B), and with expression vectors for the GEF proteins as indicated at the top of each panel. After 24 h, ratio images were taken as in Figure 2. The cells expressing Epac and Riachu-Rap1 were stimulated with forskolin and IBMX as described in Figure 3B.
None
Fig. 5. Ratio images obtained by probes with reduced sensitivity to GAPs. (A) 293T cells were transfected with expression vectors for flag-tagged Ras wild type, flag-tagged RasV12, Raichu-Ras wild type and Raichu-RasV12 with or without that for Sos. After 36 h, the cells were lysed, clarified by centrifugation, and Flag tagged and Raichu-Ras were immunoprecipitated by use of anti-Flag monoclonal antibody and anti-GFP antiserum, respectively. Guanine nucleotides bound to G proteins were separated by thin-layer chromatography, and quantitated with a BAS-1000 image analyzer. (B) Cells prepared as in (A) were lysed and clarified by centrifugation, and emission spectra at the excitation wavelength of 433 nm were obtained using a spectrometer. (C) Rap1 was analyzed as in (A). (D) Rap1 was analyzed as in (B). (E and F) Cos-1 cells expressing Raichu-RasV12 (E) or Raichu-Rap1V12 (F) were stimulated with EGF and imaged as in Figure 1A. The upper and lower panels demonstrate the ratio images and differential interference contrast images, respectively.
None
Fig. 6. Tangential FRET images of Ras and Rap1 activities. Cos-1 cells expressing monitor proteins indicated at the left were observed by two-photon excitation fluorescent microscopy. FRET efficiency of the yz-view is shown in the IMD mode.
None
Fig. 7. Spatio-temporal analysis of GEF and GAP activities in Cos-1 cells. (A) Cos-1 cells expressing Raichu-Ras were stimulated with EGF and imaged as in Figure 1A. The collected digital images of YFP and CFP were used in the following analysis. First, a line from the center to the edge of the cell was drawn. Then, pixels on this line were divided into nine segments and grouped from purple to brown. Emission ratios of pixels in each segment were averaged and plotted against time. (B) The time course of Ras activation was approximated by the first order rate equation as described in the Supplementary data. The GTP ratios of Ras before and after stimulation are expressed as kGEF/(kGAP + kGEF) and kGEF′/(kGAP + kGEF′), respectively. kGAP, kGEF and kGEF′ denote rate constants of GAP and GEF before stimulation, and of GEF after EGF stimulation, respectively. (C) Five parallel lines were drawn as in (A). The emission ratio value of each pixel was converted to the GTP ratio on Ras as described in the Supplementary data, and plotted against the distance from the center of the cell. The abscissas of the center and the edge of the cells were assigned as 0 and 1, respectively. Blue and red circles indicate pre- and post-EGF stimulation, respectively. Closed circles are the average of the values of the five open circles, which correspond to the five lines. (DkGAP (closed circles) and kGEF′ (open circles) were calculated at each pixel as a function of kGEF (k), which is assumed to be constant throughout the unstimulated cell. The data were fitted to bell-shaped curves by GraFit software. (E) The parameters obtained in (A) and (D) were assigned to Equation (a) in the Supplementary data to plot the Ras activity against time. Pixels on the five lines described in (C) were divided into five segments from the center to the periphery. The five colors, ranging from blue to red, indicate the grouping from the center to the periphery. The simulated time courses of the GTP ratio at each region are shown by the colored curves, and the actual values are shown by the colored dots.
None
Fig. 8. Spatio-temporal analysis of GEF and GAP activities for Rap1 in Cos-1 cells. (A) GTP ratio along the five parallel lines (open symbols), and average values (closed symbols) were plotted before (circles) and after (squares) stimulation as in Figure 7C. (B) Calculated GEF activities (closed circles) and GAP activities (open circles) are plotted as in Figure 7D. In both panels, the shaded area corresponds to the Golgi apparatus.
None
Fig. 9. Spatio-temporal analysis of GEF and GAP activities in semi confluent Cos-1 cells. (A) Phase contrast (PC) and FRET images of a Raichu-expressing Cos-1 cell before and after EGF stimulation. The boundary of the cell is indicated with arrowheads. Emission data on the four colored lines are collected as described in Figure 7C. (B) GTP ratios along the line in (A) were plotted as described in Figure 7C. The color of each point corresponds to the color of the lines drawn in (A). (C) Calculated GEF activities (open symbols) and GAP activities (closed symbols) at the free edge (circles) and at the edge in contact with the neighboring cell (squares) are plotted as in Figure 7D.
None
Fig. 10. Raichu-cell: a simulation of EGF activation of Ras. A virtual cell, named a Raichu-cell, was programmed on Visual Basic 6.0 with parameters obtained in Figure 7. The upper and lower rows indicate the images of the Raichu-cell and the real Cos-1 cell, respectively. Both are demonstrated in IMD mode. The time points of the images are shown in the lower right corner (min).

Similar articles

Cited by

References

    1. Adams S.R., Harootunian,A.T., Buechler,Y.J., Taylor,S.S. and Tsien,R.Y. (1991) Fluorescence ratio imaging of cyclic AMP in single cells. Nature, 349, 694–697. - PubMed
    1. Altschuler D.L. and Ribeiro-Neto,F. (1998) Mitogenic and oncogenic properties of the small G protein Rap1b. Proc. Natl Acad. Sci. USA, 95, 7475–7479. - PMC - PubMed
    1. Bos J.L. (1997) Ras-like GTPases. Biochim. Biophys. Acta, 1333, M19–M31. - PubMed
    1. Bourne H.R., Sanders,D.A. and McCormick,F. (1990) The GTPase superfamily: a conserved switch for diverse cell functions. Nature, 348, 125–132. - PubMed
    1. Brightman F.A. and Fell,D.A. (2000) Differential feedback regulation of the MAPK cascade underlies the quantitative differences in EGF and NGF signalling in PC12 cells. FEBS Lett., 482, 169–174. - PubMed

Publication types

MeSH terms