. 2003 Feb 17;22(4):925-34.
doi: 10.1093/emboj/cdg077.

The C-terminal domain of pol II and a DRB-sensitive kinase are required for 3' processing of U2 snRNA

Affiliations

The C-terminal domain of pol II and a DRB-sensitive kinase are required for 3' processing of U2 snRNA

Joanne E Medlin et al. EMBO J. .

Abstract

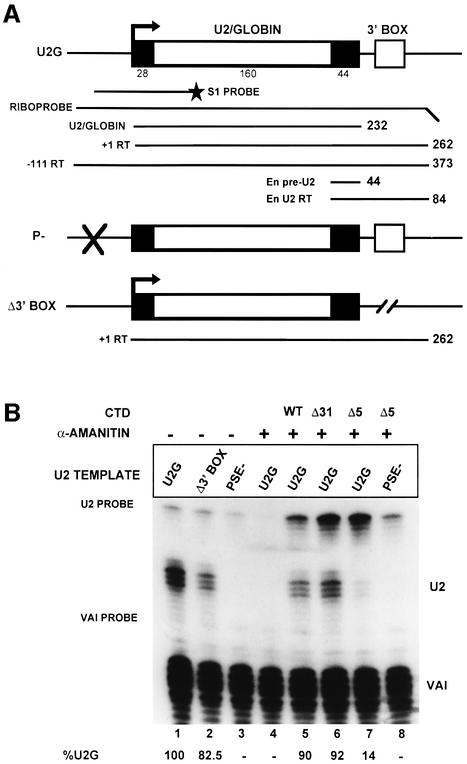
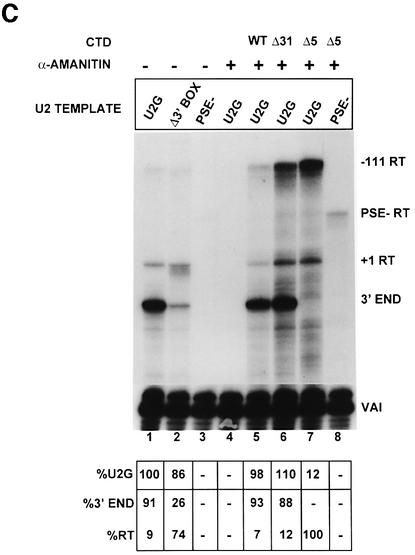
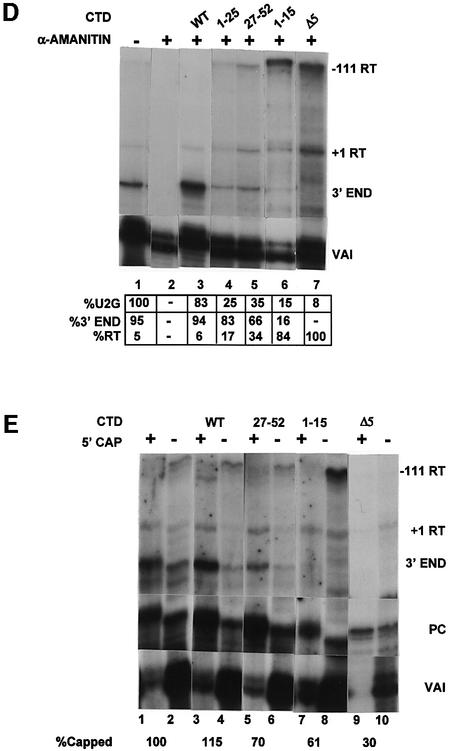
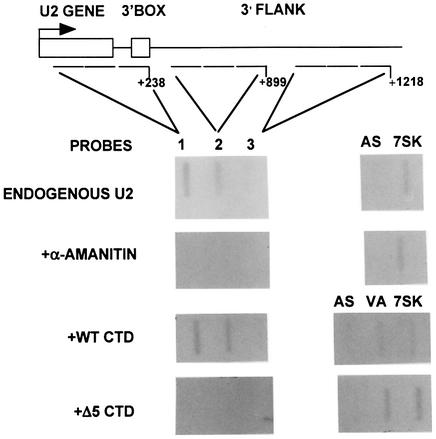
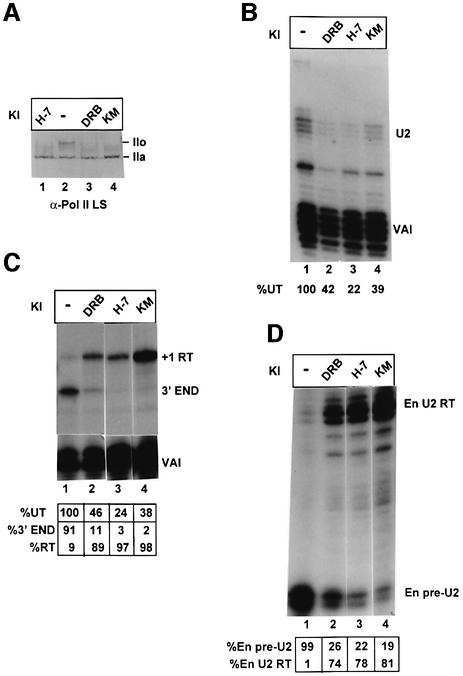
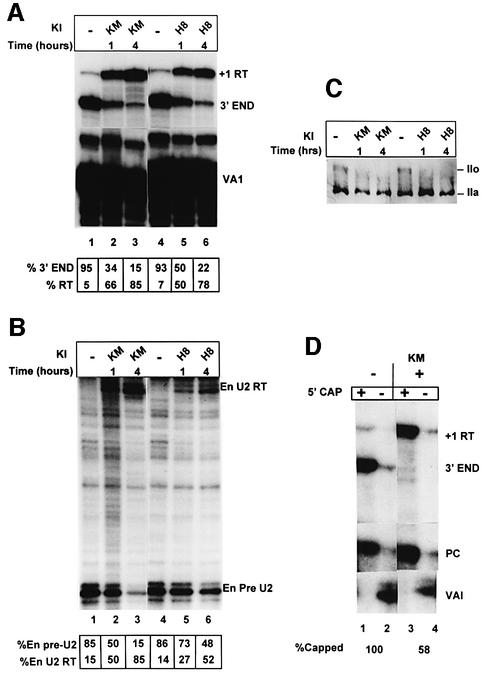
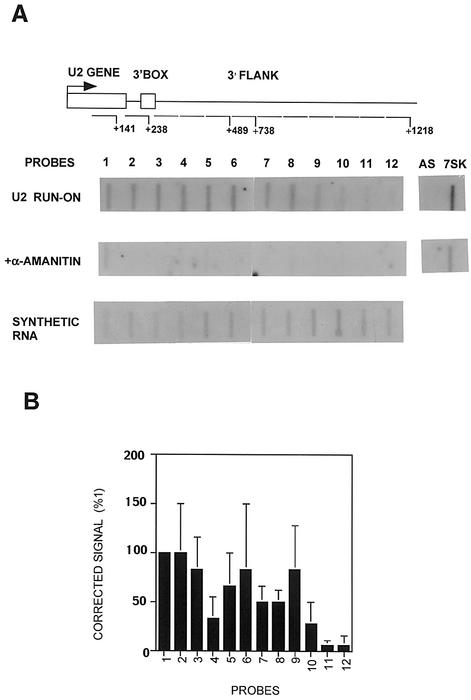
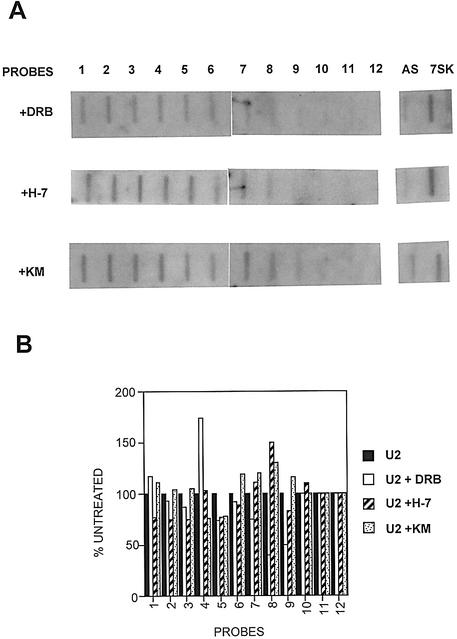
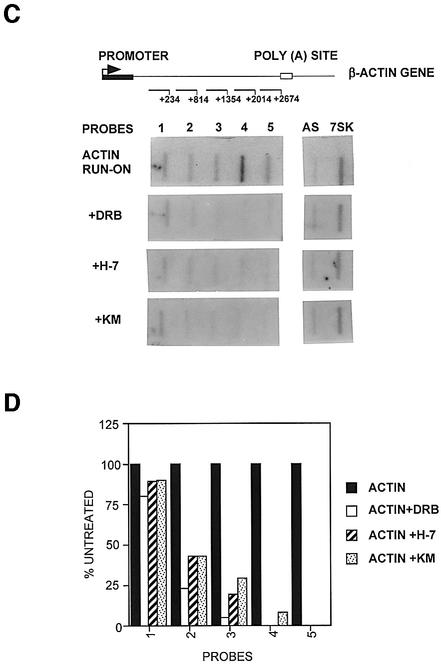
The human snRNA genes transcribed by RNA polymerase II (e.g. U1 and U2) have a characteristic TATA-less promoter containing an essential proximal sequence element. Formation of the 3' end of these non-polyadenylated RNAs requires a specialized 3' box element whose function is promoter specific. Here we show that truncation of the C-terminal domain (CTD) of RNA polymerase II and treatment of cells with CTD kinase inhibitors, including DRB (5,6-dichloro-1-beta-D-ribofuranosylbenzimidazole), causes a dramatic reduction in proper 3' end formation of U2 transcripts. Activation of 3' box recognition by the phosphorylated CTD would be consistent with the role of phospho-CTD in mRNA processing. CTD kinase inhibitors, however, have little effect on initiation or elongation of transcription of the U2 genes, whereas elongation of transcription of the beta-actin gene is severely affected. This result highlights differences in transcription of snRNA and mRNA genes.


Figures

None
Fig. 1. The CTD of pol II is required for high steady-state levels of RNA from U2 snRNA gene constructs and correct 3′ end formation of the transcripts. (A) The structure of the U2–globin (U2G) constructs (see Materials and methods). P– is transcriptionally inactive due to a mutation in the PSE of the promoter (Cuello et al., 1999). The Δ3′ box has had the 3′ box deleted (Cuello et al., 1999). The relative positions of the S1 probe and riboprobes are shown below the diagram of the U2G construct. The size of the expected products of RNase protection analysis is also noted on the right of each construct. +1RT and –111RT are products that initiate at +1 and –111, respectively, and read through beyond the mismatch with the riboprobe. (B) The results of S1 analysis of RNA transcribed from the constructs described in (A). The U2G and CTD construct used and the addition of α-amanitin is noted above each lane. The positions of S1 products corresponding to VAI RNA (VAI) (see Materials and methods) and U2–globin RNA (U2) are noted on the right, and the position of the probes is noted on the left. The amount of properly initiated U2-specific S1 product relative to lane 1 is shown below each lane. (C) The results of RNase protection analysis of RNA transcribed from the constructs described in (A). The U2G and CTD construct used and the addition of α-amanitin is noted above each lane. The positions of the protected products are noted on the right. The amount of properly initiated U2G-specific protection products relative to lane 1 is shown beneath each lane. A breakdown of the relative amount of correct 3′ end and readthrough (RT) is also noted below each lane. (D) The result of RNase protection analysis of U2G RNA transcribed by the CTD constructs indicated above the lanes. The positions of the protected products are noted on the right. The amount of properly initiated U2G-specific protection products relative to lane 1 is shown beneath each lane. A breakdown of the relative amount of correct 3′ end and readthrough (RT) is also noted below each lane. (E) The results of 5′ cap analysis of U2G RNA transcribed by the CTD constructs indicated above the lanes. RNase protection analysis was carried out on RNA selected by GST–eIF4E (capped) or unselected (uncapped) after addition of a positive control RNA (PC). The percentage of capped RNA is noted below the lanes.
None
Fig. 2. The CTD of pol II is required for transcription of U2 genes. A diagram of the structure of the U2 gene, with the relative positions of the probes marked below. The numbers noted next to the probes indicate the position of the probes relative to the site of initiation. The results of run-on analysis in the absence and presence of α-amanitin, and with co-transfected WT CTD or Δ5 CTD constructs, are shown below each probe. AS is a non-specific probe, and 7SK was used as an α-amanitin-resistant control in this and experiments shown in Figures 5 and 6. VA indicates that the probe is complementary to VAI transcripts.
None
Fig. 3. Inhibition of CTD kinases affects recognition of the 3′ box. (A) The results of western blot analysis of cells treated with 100 µM of the CTD kinase inhibitors (KI) shown above the lanes using an antibody specific for the large subunit of pol II (α-Pol II LS). The positions of the hyperphosphorylated CTD form (IIo) and the hypophosphorylated CTD form (IIa) are indicated on the right. (B) The results of S1 analysis of RNA transcribed from the U2G construct in the presence of 100 µM of the kinase inhibitors (KI) shown above the lanes. The positions of the S1 products are indicated on the right. The amount of properly initiated U2G-specific S1 product relative to the amount in untreated cells (%UT) is shown below each lane. (C) The results of RNase protection analysis of RNA transcribed from U2G in the presence of 100 µM of each kinase inhibitor (KI). The positions of the protected products are noted on the right. The amount of properly initiated U2G-specific protection products relative to the amount in untreated cells (%UT) is noted underneath each lane. A breakdown of the relative amount of correct 3′ end and readthrough (RT) is also noted below each lane. (D) The results of RNase protection analysis of endogenous U2 precursor RNA transcribed in the presence of 100 µM of each kinase inhibitor (KI). The positions of the protected products are noted on the right. A breakdown of the relative amount of correct pre-U2 3′ end and readthrough (RT) is also noted below each lane.
None
Fig. 4. Inhibition of 3′ end processing by CTD kinase inhibitors is detectable within 1 h. (A) The results of RNase protection analysis of RNA transcribed from U2G in the presence of 100 µM of each kinase inhibitor (KI). The positions of the protected products are noted on the right. The time of incubation of cells with the inhibitors is noted above the lanes. A breakdown of the relative amount of correct pre-U2 3′ end and readthrough (RT) is also noted below each lane. (B) The results of RNase protection analysis of endogenous U2 precursor RNA transcribed in the presence of 100 µM of the kinase inhibitors (KI) shown above the lanes. The positions of the protected products are indicated on the right. The time of incubation of cells with the inhibitors is noted above the lanes. A breakdown of the relative amount of correct pre-U2 3′ end and readthrough (RT) is also noted below each lane. (C) The results of western blot analysis of cells treated with 100 µM of the CTD kinase inhibitors KM05283 and H-8 using an antibody specific for the large subunit of pol II. The positions of the hyperphosphorylated CTD form (IIo) and the hypophosphorylated CTD form (IIa) are indicated on the right. The time of incubation of cells with the inhibitors is noted above the lanes. (D) The results of 5′ cap analysis of U2G RNA from untreated and KM05832-treated cells. RNase protection analysis was carried out on RNA selected by GST–eIF4E (capped) or unselected (uncapped). The percentage of capped RNA (see Materials and methods) is noted below the lanes.
None
Fig. 5. Transcription of the U2 gene terminates 1 kb downstream from the site of initiation and is unaffected by CTD kinase inhibitors. (A) A diagram of the structure of the U2 gene, with the relative positions of the run-on probes marked below. The numbers noted next to the probes indicate the end of the probes used relative to the site of initiation. The results of run-on analysis, in the absence or presence of α-amanitin, and hybridization of synthetically produced RNA to the probes are shown below each probe. (B) A graphic representation of the results of the run-on analysis in (A) as a percentage of the signal over probe 1 after subtraction of α-amanitin-resistant transcription and correction for the hybridization efficiency of each probe.
None
Fig. 6. Hyperphosphorylation of the CTD of pol II is not necessary for efficient transcription of the U2 gene. (A) The results of run-on analysis of the U2 genes in the presence of 100 µM CTD kinase inhibitors (indicated on the left) are shown below each probe. (B) A graphic representation of the results of the run-on analysis in (A) as a percentage of the signal over each probe relative to an untreated control (see Figure 5). (C) A diagram of the structure of the β-actin gene, with the relative positions of the probes marked below. The numbers noted next to the probes indicate the position of the end of the probes relative to the site of initiation. The results of run-on analysis in the absence or presence of 100 µM kinase inhibitors (indicated at left) are shown below each probe. (D) A graphic representation is shown of the results of the run-on analysis in (C) as a percentage of the signal over each probe relative to the untreated control.

Similar articles

Cited by

References

    1. Akoulitchev S., Makela,T.P., Weinberg,R.A. and Reinberg,D. (1995) Requirement for TFIIH kinase activity in transcription by RNA polymerase II. Nature, 377, 557–560. - PubMed
    1. Akoulitchev S., Chuikov,S. and Reinberg,D. (2000) TFIIH is negatively regulated by cdk8-containing mediator complexes. Nature, 407, 102–106. - PubMed
    1. Aranda A. and Proudfoot,N.J. (2001) Transcriptional termination factors for RNA polymerase II in yeast. Mol. Cell, 7, 1003–1011. - PubMed
    1. Bentley D. (2002) The mRNA assembly line: transcription and processing machines in the same factory. Curr. Opin. Cell Biol., 14, 336–342. - PubMed
    1. Bernues J., Simmen,K.A., Lewis,J.D., Gunderson,S.I., Moncollin,M., Egly,J.-M. and Mattaj,I.W. (1993) Common and unique transcription factor requirements of human U1 and U6 snRNA genes. EMBO J., 12, 3573–3585. - PMC - PubMed

Publication types

MeSH terms