. 2003 Feb 1;23(3):883-94.
doi: 10.1523/JNEUROSCI.23-03-00883.2003.

Fibroblast growth factor receptor 3 signaling regulates the onset of oligodendrocyte terminal differentiation

Affiliations

Fibroblast growth factor receptor 3 signaling regulates the onset of oligodendrocyte terminal differentiation

Luke Y S Oh et al. J Neurosci. .

Abstract

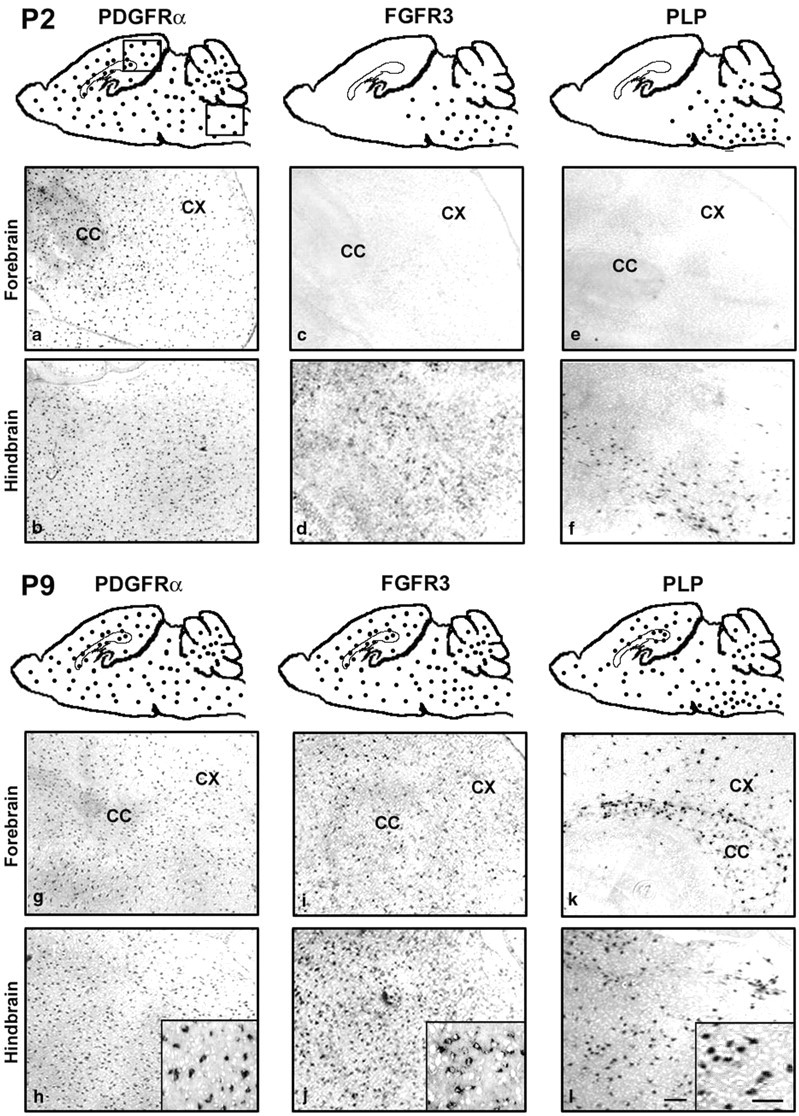
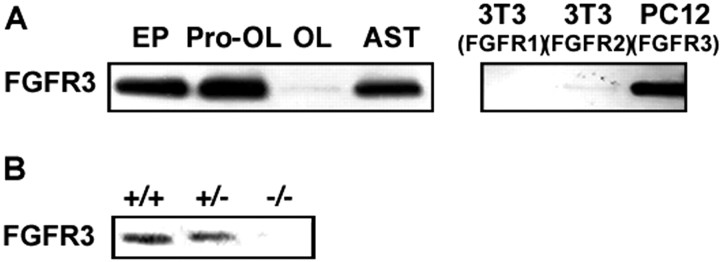
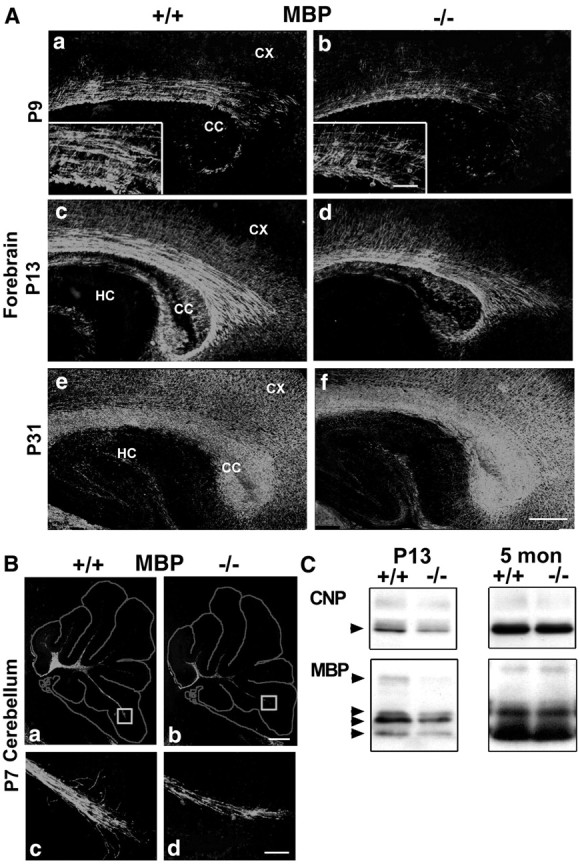
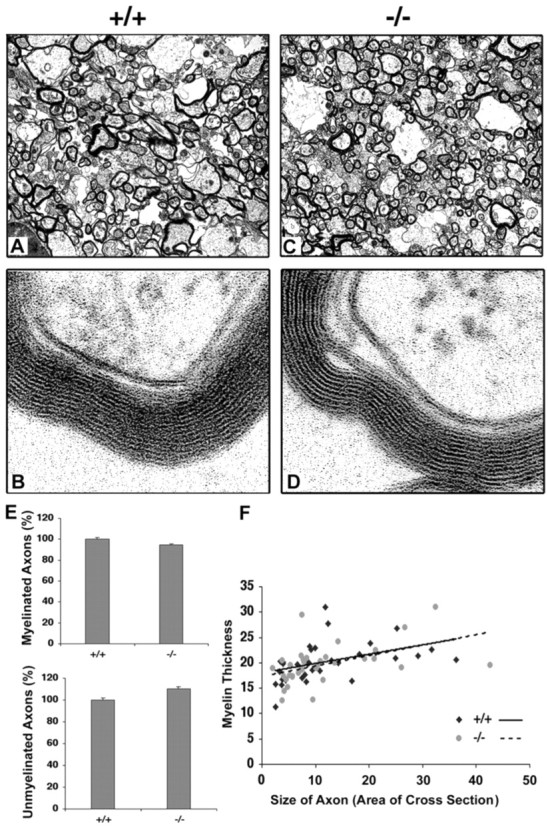
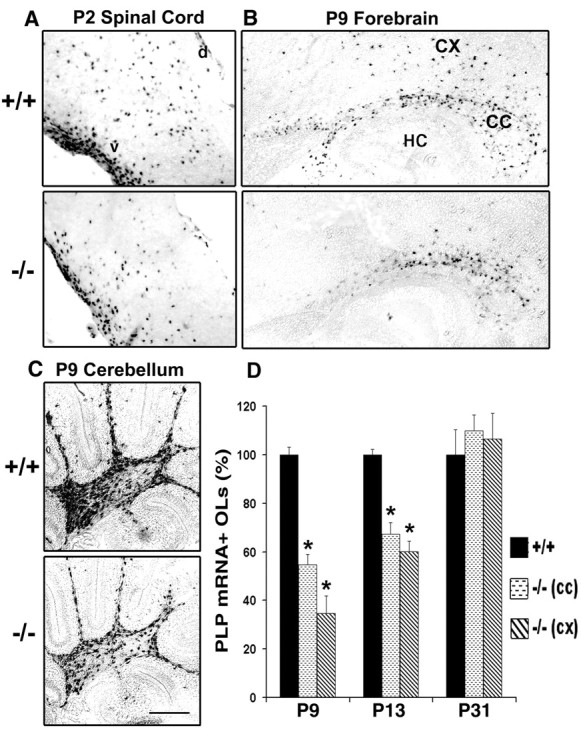
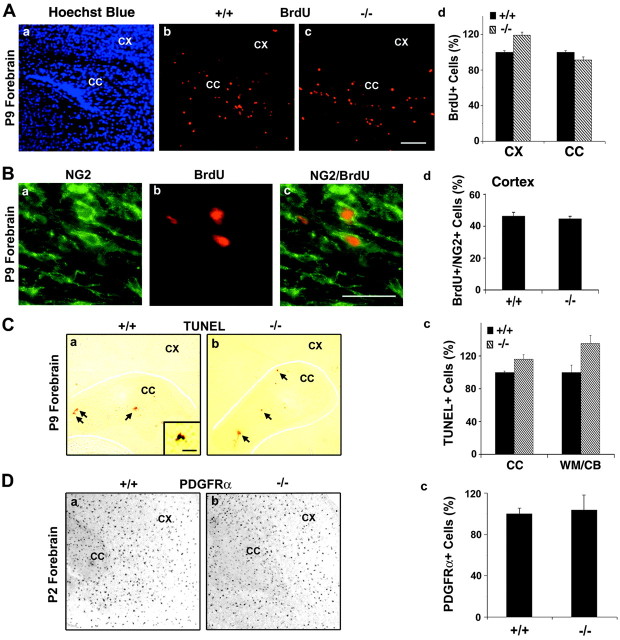
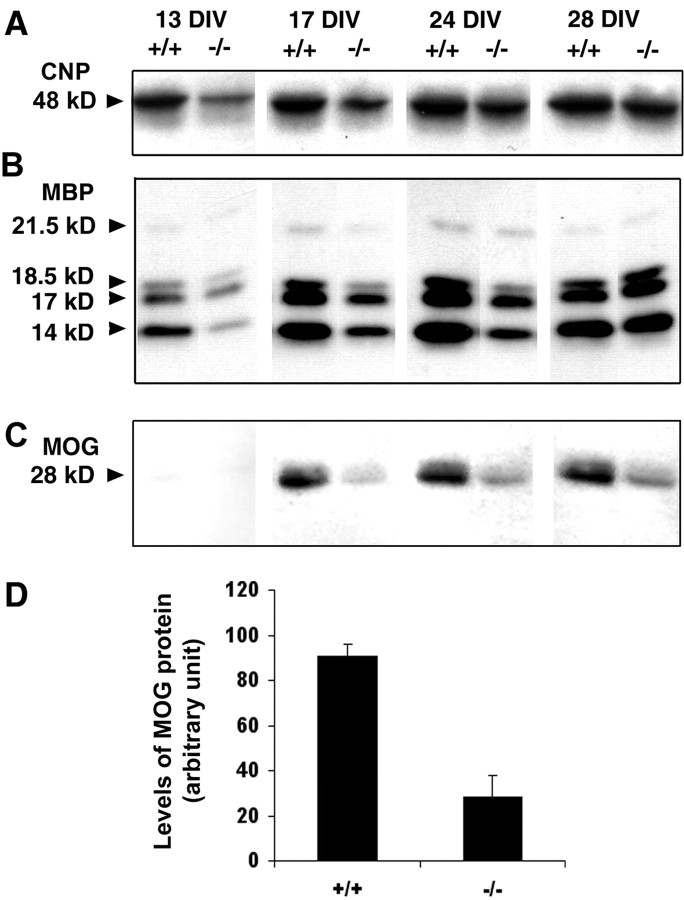
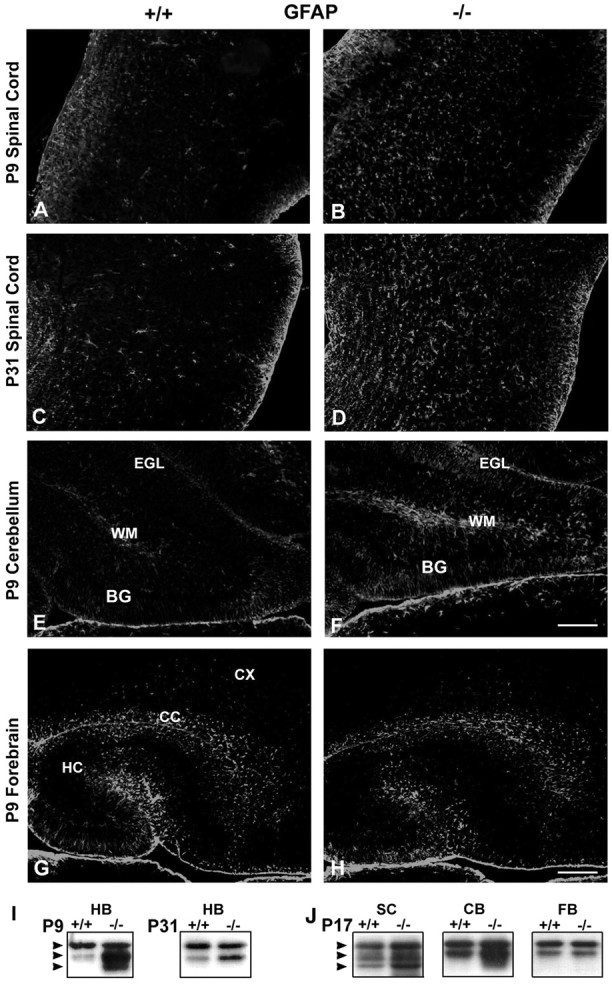
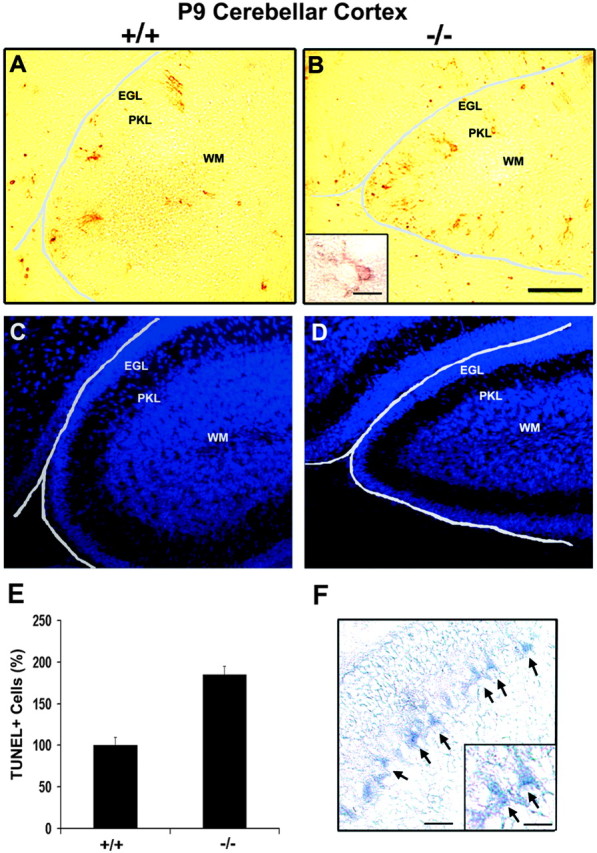
Fibroblast growth factor receptor (FGFR) signaling is essential for nervous system development. We have shown that, in the normal postnatal brain, the spatial and temporal expression pattern of FGFR3 parallels the appearance of differentiated oligodendrocytes and that in culture FGFR3 is expressed maximally at the critical stage in the lineage at which oligodendrocyte late progenitors (Pro-OLs) enter terminal differentiation. Therefore, FGFR3 expression is positioned ideally to have an impact on oligodendrocyte differentiation. In support of this we show that, during the onset and active phase of myelination in FGFR3-deficient mice, there are reduced numbers of differentiated oligodendrocytes in the forebrain, cerebellum, hindbrain, and spinal cord. Furthermore, myelination is delayed in parallel. Delay of oligodendrocyte differentiation also is observed in primary cell culture from this mutant. On the other hand, no differences are observed in the survival or proliferation of oligodendrocyte progenitors. This suggests that the decrease in the number of differentiated oligodendrocytes is attributable to a delay in the timing of their differentiation process. Astrocytes also express FGFR3, and in mice lacking FGFR3 there is an enhancement of the astrocytic marker glial fibrillary acidic protein expression in a region-specific manner. Thus our findings suggest that there are cell type- and region-specific functions for FGFR3 signaling and in particular emphasize a prominent role for FGFR3 as part of a system regulating the onset of oligodendrocyte terminal differentiation.


Figures

Fig. 1.
Fig. 1.
Spatiotemporal expression of FGFR3 mRNA in normal brain. Parasagittal sections of wild-type mouse brain were analyzed byin situ hybridization for PDGFRα, FGFR3, and PLP mRNA at P2 and P9. The regional distributions of positive cells are shown diagrammatically as dots and as representative sections taken from forebrain and hindbrain from regions marked by abox. Higher magnifications are shown asinsets. The temporal wave of FGFR3 mRNA expression moves from caudal to rostral brain in parallel to that for PLP but not PDGFRα. CC, Corpus callosum; CX, cortex. Scale bars: (in l) a–l, 100 μm; insets, 50 μm.
Fig. 2.
Fig. 2.
The expression of FGFR3 protein is regulated during the maturation of OL lineage cells. A, Purified cells from rat forebrain, at three stages of OL maturation and astrocytes, were analyzed by immunoblotting for FGFR3. Equal amounts of total protein (50 μg) were loaded in each lane. FGFR3 protein is expressed by early progenitors (EP), is increased substantially as EPs mature to Pro-OLs, and is downregulated dramatically to undetectable levels with the terminal differentiation of progenitors into OLs (OL). Astrocytes (AST) also express FGFR3 protein. Analyses of homogenates (2 μg) from transfected cell lines (3T3 and PC12) overexpressing FGFR1, FGFR2, or FGFR3 demonstrate the specificity of the antibody used for FGFR3. B, Immunoblots of homogenates (50 μg) from P9 wild types (+/+), heterozygotes (+/−), and FGFR3 null (−/−) hindbrains with anti-FGFR3 show the loss of FGFR3 protein to undetectable levels in FGFR3 null animals. Representative experiments of three are shown.
Fig. 3.
Fig. 3.
Myelin formation is delayed in FGFR3 null mice brain. Parallel parasagittal sections from forebrain (A) and cerebellum (B) of wild-type (+/+) and FGFR3 null (−/−) mice were analyzed by immunohistochemistry for MBP, a marker for myelinated fibers. In the forebrain of FGFR3 null mice, when compared with wild-type mice, fewer myelinated fibers developed initially, as seen at both P9 (Aa, Ab; higher magnifications are shown in insets) and P13 (Ac, Ad); this difference became comparable with wild type by P31 (Ae, Af). B, In cerebellar white matter there were also fewer myelinated fibers in the FGFR3 null mice when compared with the wild type, as shown in a representative section taken at P7 (Ba, Bb). Theboxed regions are shown at higher magnification (Bc, Bd). A, B, Two to four sections each from three to nine mice from each group and age were analyzed; similar results were obtained. CC, Corpus callosum;CX, cortex; HC, hippocampus. Scale bars:Af, 100 μm; insets (for A, Bc, Bd), 50 μm. C, Immunoblot analysis of forebrain homogenates from wild-type (+/+) and FGFR3 null (−/−) mice. Compared with wild-type mice, in FGFR3 null mice the levels of CNP and MBP isoforms were reduced at P13; however, they reached wild-type levels by adulthood.
Fig. 4.
Fig. 4.
Ultrastructural analysis of myelinated axons in FGFR3 null mice. Cross sections of corpus callosum from 2-month-old littermate wild-type (+/+) and FGFR3 null (−/−) mice were analyzed by electron microscopy at low (A, C; 8230×) and high (B, D; 193,000×) magnification. E, Numbers of myelinated and unmyelinated axons were counted from the two groups (∼70 randomly chosen axons each). Wild-type number are set to 100%, and FGFR3 null levels are shown relative to that. Error bars indicate SEM. F, Thickness of myelin sheath and size of axon (arbitrary units) were measured from 30 randomly chosen myelinated axons from each group (NIH Image software). No apparent differences were observed in the ultrastructure of myelin between the two groups of mice.
Fig. 5.
Fig. 5.
Oligodendrocyte differentiation is delayed in FGFR3 null mice in vivo. Parasagittal sections taken from parallel regions of wild-type (+/+) and FGFR3 null (−/−) mice from spinal cord at P2 (A), forebrain at P9, P13, and P31 (P9; B, D), and cerebellum at P9 (C) were analyzed by in situhybridization for the OL marker PLP mRNA. Fewer PLP mRNA+ cells were present in FGFR3 null compared with wild-type mice of the same age in all three regions of the brain (A–C); representative sections are shown. Sections hybridized with sense cRNA probe showed no labeling (data not shown). Scale bar, 100 μm. D, Quantification of the number of PLP mRNA+ cells that differentiated as a function of time in the corpus callosum (CC) and the cortex (CX) of wild-type and FGFR3 null mice. All PLP mRNA+ cells in the entire cortical or corpus callosum region were counted for each section. Two to four sections each from three to nine mice from each group and age were counted. Wild-type numbers (average of all +/+ animals) were set to 100%; FGFR3 null (−/−) numbers are shown relative to that. The numbers of PLP mRNA+ OLs were reduced at P9 and P13 in FGFR3 null corpus callosum and cerebral cortex, which became comparable with that of wild type by P31. HC, Hippocampus; d, dorsal region of the spinal cord; v, ventral region of the spinal cord. Error bars indicate SEM (n = 3–9); *p < 0.005, unpaired Student'st test.
Fig. 6.
Fig. 6.
Proliferation and survival of OL progenitors is not altered in FGFR3 null mice. P9 sagittal sections taken from parallel regions of wild-type (+/+) and FGFR3 null (−/−) mice were analyzed. A, B, BrdU incorporation analyzed by immunohistochemistry was used as a measure of proliferation (Ab–Ad). The sections were counterstained with Hoechst dye (Aa) to show the region of the brain that was analyzed. Scale bar, 100 μm. The total number of BrdU+ cells (Ad) was obtained by counting all BrdU+ cells in either the entire cerebral cortex (CX) or splenium of the corpus callosum region (CC) for each section. B, Cells double-immunolabeled with NG2 (Ba) and BrdU (Bb) are shown as a merged image (Bc) at higher magnification than in A. The percentage of BrdU+ cells colabeled with anti-NG2 estimates the number of proliferating OL progenitors (Bd). Neither the total numbers of proliferating cells nor the number of NG2+/BrdU+ cells showed significant differences between wild-type and FGFR3 null forebrain.C, TUNEL assay was used as a measure of cell death. TUNEL+ cells in the subependymal germinal zone of P9 forebrain are shown. Inset, High magnification (Ca, Cb, arrows). Two to four sections from three animals from each group were counted. The total number of TUNEL+ cells in either the entire cortex plus corpus callosum regions (CC) or in the whole cerebellar white matter (WM/CB; Cc) was counted for each section. Wild-type numbers were set to 100%; FGFR3 null levels are shown relative to that. No statistically significant differences were observed between the two groups. Scale bars: 100 μm;insets, 30 μm. D, PDGFRα mRNAin situ hybridization was used to identify OL progenitors. No obvious differences were observed between the numbers of PDGFRα mRNA+ cells at P2 in the forebrain of the wild-type and FGFR3 null mice. Scale bar, 100 μm. Error bars indicate SEM (n = 3).
Fig. 7.
Fig. 7.
Analysis of OL differentiation in mixed primary cell cultures from FGFR3 null forebrain. Mixed primary cell cultures initiated from P2 forebrain were analyzed by immunoblotting as a function of time in culture for wild-type (+/+) and FGFR3 null (−/−) littermate mice for the OL differentiation markers. A, CNP; B, MBP; C, MOG. D, Representative examples for the time courses of CNP, MBP, and MOG and quantification for MOG (NIH Image analysis) at one time point (17 DIV) are shown (n = 3 for wild type;n = 5 for mutants); p < 0.05. Then 10 μg of total protein was loaded in each lane. Note that, similar to in vivo, the expression of OL differentiation markers was delayed in vitro in the FGFR3 null mice compared with wild type.
Fig. 8.
Fig. 8.
Astrocytic protein, GFAP, is increased in FGFR3 null mice. P9 and P31 parasagittal sections taken from parallel regions of wild-type (+/+) and FGFR3 null (−/−) spinal cord (A–D) at the most dorsal cervical region (just below the medulla), P9 cerebellum (E, F), and P9 forebrain (G, H) were immunolabeled with anti-GFAP. Two to four sections each from three to five mice from each group were analyzed. Representative sections are shown. Scale bars: (inF), A–F, 50 μm; (inH),G, H, 100 μm.BG, Bergmann glia; CX, cortex;CC, corpus callosum; EGL, external granular layer; HC, hippocampus; WM, white matter. A–D, Spinal cord orientation: dorsal (right), ventral (left), rostral (top), caudal (bottom). I, J, GFAP immunoblot analysis of homogenates from hindbrain (HB), spinal cord (SC), cerebellum (CB), and forebrain (FB) from wild-type (+/+) and FGFR3 null (−/−) mice is shown at P9, P17, and P31. Compared with wild type, in mutant mice there was an increased expression of GFAP in the spinal cord, cerebellum, and hindbrain. In contrast, no increase was seen in the forebrain. The increase in spinal cord and hindbrain GFAP immunolabeling continued into adulthood.
Fig. 9.
Fig. 9.
Cell death in the cerebellar cortex is increased in FGFR3 null mice. A, B, Parallel parasagittal sections of cerebella from P9 wild-type (+/+) and FGFR3 null (−/−) mice were analyzed by TUNEL assay. C, D, These sections were counterstained with Hoechst dye to show the regions analyzed inA and B. Scale bars: (inB), A–D, 100 μm; inset, 25 μm. E, TUNEL+ cells were counted from two to four sections each in the area covering the entire cerebellar cortex from three separate animals in each group. The wild-type values are set to 100%, and mutant numbers are plotted as a percentage of wild type. There was a significant increase in cell death in the Purkinje (PKL) and granule cell layers. Error bars indicate SEM (n = 3). *p< 0.1, unpaired Student's t test. F,In situ hybridization for FGFR3 mRNA shows a signal in Purkinje cell layer (arrows). Scale bars:F, 50 μm; inset, 25 μm.EGL, External germinal layer; WM, white matter.

References

    1. Albrecht PJ, Dahl JP, Stoltzfus OK, Levenson R, Levison SW. Ciliary neurotrophic factor activates spinal cord astrocytes, stimulating their production and release of fibroblast growth factor-2, to increase motor neuron survival. Exp Neurol. 2002;173:46–62. - PubMed
    1. Araujo DM, Cotman CW. Basic FGF in astroglial, microglial, and neuronal cultures: characterization of binding sites and modulation of release by lymphokines and trophic factors. J Neurosci. 1992;12:1668–1678. - PMC - PubMed
    1. Arman E, Haffner-Krausz R, Chen Y, Heath JK, Lonai P. Targeted disruption of fibroblast growth factor (FGF) receptor 2 suggests a role for FGF signaling in pregastrulation mammalian development. Proc Natl Acad Sci USA. 1998;95:5082–5087. - PMC - PubMed
    1. Asai T, Wanaka A, Kato H, Masana Y, Seo M, Tohyama M. Differential expression of two members of FGF receptor gene family, FGFR1 and FGFR2 mRNA, in the adult rat central nervous system. Brain Res Mol Brain Res. 1993;17:174–178. - PubMed
    1. Baas D, Legrand C, Samarut J, Flamant F. Persistence of oligodendrocyte precursor cells and altered myelination in optic nerve associated to retina degeneration in mice devoid of all thyroid hormone receptors. Proc Natl Acad Sci USA. 2002;99:2907–2911. - PMC - PubMed

Publication types

MeSH terms

Substances