

Aging results in hypermethylation of ribosomal DNA in sperm and liver of male rats
- PMID: 12574505
- PMCID: PMC149909
- DOI: 10.1073/pnas.0437971100
Aging results in hypermethylation of ribosomal DNA in sperm and liver of male rats
Abstract
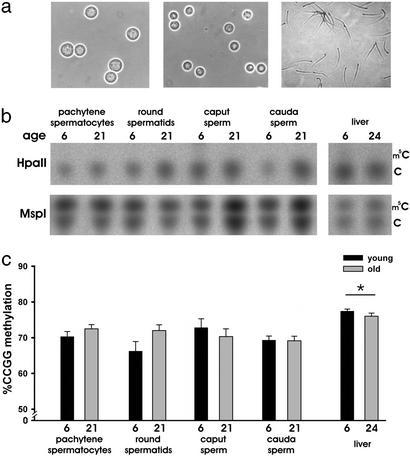
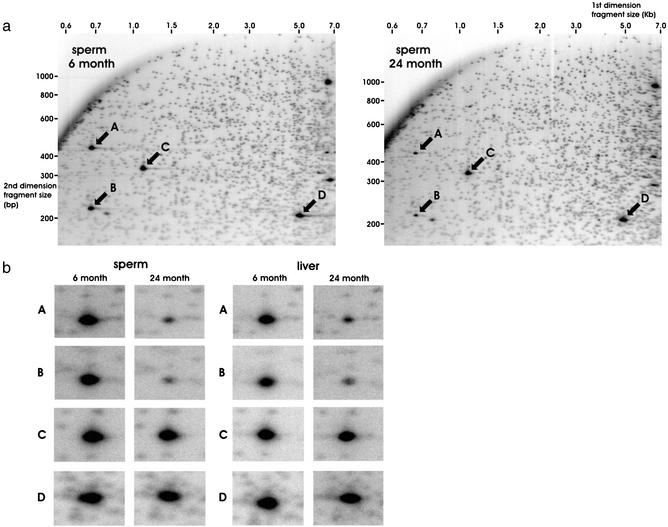
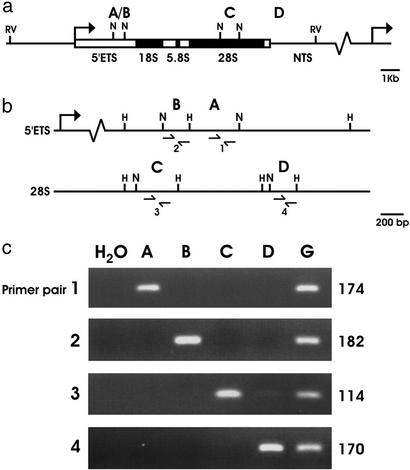
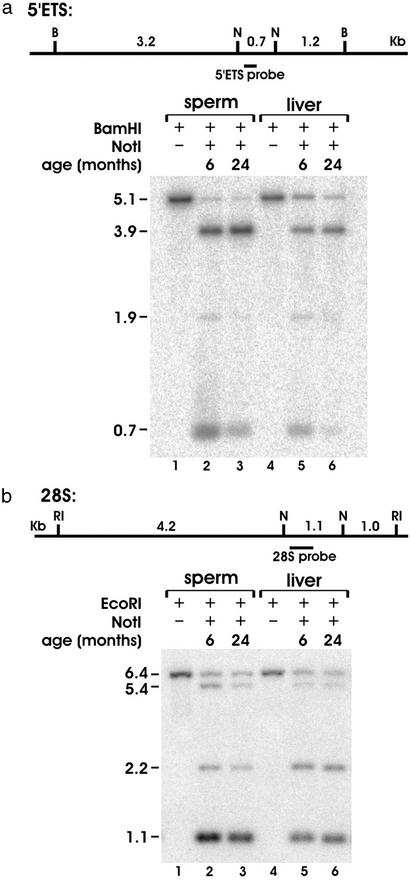
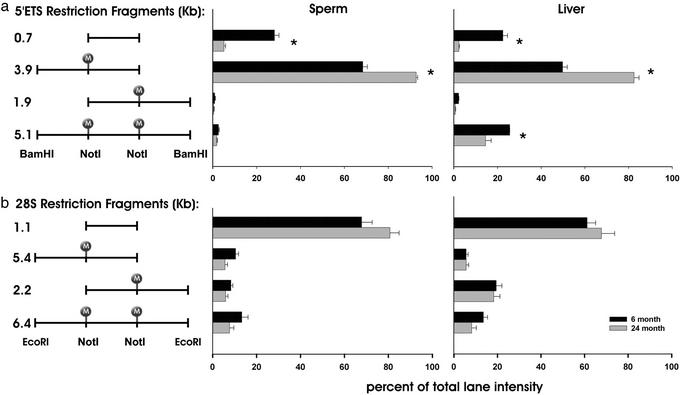
There is a concern that increased paternal age may be associated with altered fertility and an increased incidence of birth defects in man. In previous studies of aged male rats, we have found abnormalities in the fertility and in the embryos sired by older males. Aging in mammals is associated with alterations in the content and patterns of DNA methylation in somatic cells; however, little is known in regard to germ cells. A systematic search for global and gene-specific alterations of DNA methylation in germ cells and liver of male rats was done. Restriction landmark genomic scanning, a method used to determine specific methylation patterns of CpG island sequences, has revealed a region of the ribosomal DNA locus that is preferentially hypermethylated with age in both spermatozoa and liver. In contrast, all single copy CpG island sequences in spermatozoa and in liver remain unaltered with age. We further demonstrate that a large proportion of rat ribosomal DNA is normally methylated and that regional and site-specific differences exist in the patterns of methylation between spermatozoa and liver. We conclude that patterns of ribosomal DNA methylation in spermatozoa are vulnerable to the same age-dependent alterations that we observe in normal aging liver. Failure to maintain normal DNA methylation patterns in male germ cells could be one of the mechanisms underlying age-related abnormalities in fertility and progeny outcome.
Figures
Similar articles
-
High-resolution analyses of human sperm dynamic methylome reveal thousands of novel age-related epigenetic alterations.Clin Epigenetics. 2020 Dec 14;12(1):192. doi: 10.1186/s13148-020-00988-1. Clin Epigenetics. 2020. PMID: 33317634 Free PMC article.
-
Aberrant DNA methylation patterns of spermatozoa in men with unexplained infertility.Hum Reprod. 2015 May;30(5):1014-28. doi: 10.1093/humrep/dev053. Epub 2015 Mar 9. Hum Reprod. 2015. PMID: 25753583
-
Methylation of the ribosomal RNA gene promoter is associated with aging and age-related decline.Aging Cell. 2017 Oct;16(5):966-975. doi: 10.1111/acel.12603. Epub 2017 Jun 17. Aging Cell. 2017. PMID: 28625020 Free PMC article.
-
Genomic changes in spermatozoa of the aging male.Adv Exp Med Biol. 2014;791:13-26. doi: 10.1007/978-1-4614-7783-9_2. Adv Exp Med Biol. 2014. PMID: 23955670 Review.
-
Origin and roles of genomic methylation patterns in male germ cells.Semin Cell Dev Biol. 1998 Aug;9(4):467-74. doi: 10.1006/scdb.1998.0225. Semin Cell Dev Biol. 1998. PMID: 9813194 Review.
Cited by
-
Ribosomal DNA harbors an evolutionarily conserved clock of biological aging.Genome Res. 2019 Mar;29(3):325-333. doi: 10.1101/gr.241745.118. Epub 2019 Feb 14. Genome Res. 2019. PMID: 30765617 Free PMC article.
-
Epigenetics recording varied environment and complex cell events represents the origin of cellular aging.J Zhejiang Univ Sci B. 2019 Jul;20(7):550-562. doi: 10.1631/jzus.B1800507. J Zhejiang Univ Sci B. 2019. PMID: 31168969 Free PMC article. Review.
-
Influence of paternal preconception exposures on their offspring: through epigenetics to phenotype.Am J Stem Cells. 2016 May 15;5(1):11-8. eCollection 2016. Am J Stem Cells. 2016. PMID: 27335698 Free PMC article. Review.
-
Postnatal development- and age-related changes in DNA-methylation patterns in the human genome.Nucleic Acids Res. 2012 Aug;40(14):6477-94. doi: 10.1093/nar/gks312. Epub 2012 Apr 11. Nucleic Acids Res. 2012. PMID: 22495928 Free PMC article.
-
Epidemiological, genetic and epigenetic aspects of the research on healthy ageing and longevity.Immun Ageing. 2012 Apr 23;9(1):6. doi: 10.1186/1742-4933-9-6. Immun Ageing. 2012. PMID: 22524317 Free PMC article.
References
Publication types
MeSH terms
Substances
Grants and funding
LinkOut - more resources
Full Text Sources
Other Literature Sources
Medical
