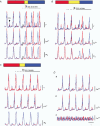
. 2003 Apr 1;548(Pt 1):271-96.
doi: 10.1113/jphysiol.2002.033720. Epub 2003 Feb 7.

Ca2+ phase waves: a basis for cellular pacemaking and long-range synchronicity in the guinea-pig gastric pylorus

Affiliations

Ca2+ phase waves: a basis for cellular pacemaking and long-range synchronicity in the guinea-pig gastric pylorus

Dirk F van Helden et al. J Physiol. .

Abstract

Ca2+ imaging and multiple microelectrode recording procedures were used to investigate a slow wave-like electrical rhythmicity in single bundle strips from the circular muscle layer of the guinea-pig gastric pylorus. The 'slow waves' (SWs) consisted of a pacemaker and regenerative component, with both potentials composed of more elementary events variously termed spontaneous transient depolarizations (STDs) or unitary potentials. STDs and SW pacemaker and regenerative potentials exhibited associated local and distributed Ca2+ transients, respectively. Ca2+ transients were often larger in cellular regions that exhibited higher basal Ca2+ indicator-associated fluorescence, typical of regions likely to contain intramuscular interstitial cells of Cajal (ICCIM). The emergence of rhythmicity arose through entrainment of STDs resulting in pacemaker Ca2+ transients and potentials, events that exhibited considerable spatial synchronicity. Application of ACh to strips exhibiting weak rhythmicity caused marked enhancement of SW synchronicity. SWs and underlying Ca2+ increases exhibited very high 'apparent conduction velocities' ('CVs') orders of magnitude greater than for sequentially conducting Ca2+ waves. Central interruption of either intercellular connectivity or inositol 1,4,5-trisphosphate receptor (IP3R)-mediated store Ca2+ release in strips caused SWs at the two ends to run independently of each other, consistent with a coupled oscillator-based mechanism. Central inhibition of stores required much wider regions of blockade than inhibition of connectivity indicating that stores were voltage-coupled. Simulations, made using a conventional store array model but now including depolarization coupled to IP3R-mediated Ca2+ release, predicted the experimental findings. The linkage between membrane voltage and Ca2+ release provides a means for stores to interact as strongly coupled oscillators, resulting in the emergence of Ca2+ phase waves and associated pacemaker potentials. This distributed pacemaker triggers regenerative Ca2+ release and resultant SWs.


Figures
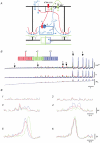
Figure 11
Figure 11. Global stimulation of a store array model simulates the emergence of rhythmicity
A, schema showing a single cell coupled to its neighbours by gap junctions. The interplay of Ca2+ (blue), IP3 (red) and membrane potential (green) are indicated. See text for further details. B, simulation of the response to a ramp increase of [IP3] (stimulus β increased from 0.0 to 0.51 μm at a rate of 0.0036 μm min−1) in a 10 mm one-dimensional model strip comprised of 100 cells. The records present the average changes in membrane potential, cytosolic [Ca2+] and [IP3] for the 3 colour-coded regions shown in the schema. C, expanded records of [Ca2+] marked in B show the initial store activity (C1), the onset of entrainment of store-related activity (C2), the evolution of sub-threshold pacemaker events (C3 and 4) and then super-threshold pacemaker events triggering regenerative store release (C5 and 6). See Methods for details of the modelling and parameter values. An animation for a similar simulation (but for a two-dimensional tissue) can be seen on:
Figure 1
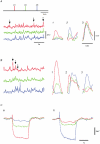
Figure 1. Spatially synchronous Ca2+ transients associated with strip ‘slow waves’
A, SWs recorded near the middle of a strip and aligned associated transient increases in relative [Ca2+]i for the entire image (sum) and for the marked regions of interest (ROIs) shown in C. The tissue length viewed was 0.2 mm, occupied ∼0.3 of the vertical image and was imaged at a rate of ∼5 Hz. Vm was −55 mV. Nifedipine (1 μm) was present throughout. B, the space-time image showing the temporal changes in relative intensity for all the ROIs shown in C. This plot presents the intensity of ROIs within each row (NB: rows a, b and c-h have 2, 4 and 9 ROIs, respectively) plotted as a vertical sequence of values for each time point. Data for each ROI has been baseline corrected by subtracting the mean intensity of the ROI. C, confocal image of the Oregon Green-loaded tissue and ROI grid over which the measurements were made. D and E, difference images (i.e. image at the peak of activity minus image directly before activity) for SW * in A and for the average of 10 sequential slow waves (SWs). The insets show the corresponding SWs (blue) and associated aligned mean relative Ca2+ transients (red) (normalized scales). F, intramuscular interstitial cells labelled with Kit antibody ACK2 in a composite confocal image of a tissue strip taken over a depth of 17 μm. G, composite image (depth 8 μm) of an Oregon Green-loaded tissue taken within 15 min after loading. H, composite image (depth 3 μm) of the same tissue region as G but after fixation and immunohistochemical labelling with the Kit antibody with arrows pointing to the same cells as arrows in G (note fixation shrinkage). Intensity scale in E applies to all images except C. Scale bar in E applies to all images except for vertical axes of G and H, which are expanded × 3.
Figure 2
Figure 2. Spatially synchronous Ca2+ transients associated with sub-threshold pacemaker potentials and SWs
A, SW pacemaker and regenerative potentials aligned with the associated transient increases in mean relative [Ca2+]i for the entire image (sum) and for the marked ROIs shown in image E. B, the space-time plot (see Fig. 1 legend). C and D, difference images for the marked pacemaker potential (PP2) and SW (SW2). E, Oregon-Green loaded tissue showing the confocal image and ROI grid over which intensity measurements were made. F and G, difference images for the mean of 5 sequential pacemaker and SW events. H, difference image for the mean of 5 SW events recorded before application of nifedipine. Insets show the corresponding pacemaker potentials or SWs (blue) with aligned associated relative increases in [Ca2+]i (red, normalized scales). Nifedipine (1 μm) present throughout except for H. Intensity scale in H applies to all images except E. Vm−56 mV.
Figure 3
Figure 3. Ca2+ transients associated with spontaneous transient depolarizations
A, imaged region of Oregon Green-loaded strip with ROI grid superimposed. B and C, recording of strip membrane potential (blue) aligned with the associated recording of relative [Ca2+]i from an active ROI (a2) before and during application of nifedipine (1 μm). D, STD aligned with the sum of the Ca2+ traces for the active regions (on a normalized scale) and the relative Ca2+ traces for the specific ROIs before nifedipine. E, the corresponding difference image. F, the mean of 9 STDs aligned with the associated Ca2+ transients (the latter on a normalized scale); G, the mean of the difference images for these same events. H, I, J and K, data sequence as for D, E, F and G showing activity associated with STD-triggered L-type Ca2+ channel-mediated action potentials, one of which is marked * in B. L, M, N and O, data sequence as for D, E, F and G now recorded during nifedipine (1 μm). Intensities of the ROIs in D, H and L are plotted on a relative scale compared to the largest Ca2+ transient recorded. Scale bars in D apply to corresponding records. Mean records based on 9, 3 and 7 events for F, J and N, respectively. Time and voltage scale bars in F apply to all traces except B and C. Intensity scale in G applies to all images except A. Vm−53 mV.
Figure 4
Figure 4. Local and distributed spontaneous transient depolarizations
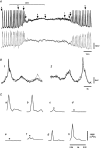
STD activity recorded from a strip at 3 sites according to the schema (note electrode colour codes), under control conditions (A) and just after application of 50 nm ACh (B) in a strip where recordings were made before the onset of SWs. Simultaneous multiple electrode recording indicated that STDs arose as either ‘local events’ which showed rapid decrement or ‘distributed events’ which underwent little decrement between recording sites. C, injection of a −3 nA current (duration 2 s) through electrodes 1 (a) and 3 (b), respectively (NB: recordings through current passing electrodes made in bridge recording mode; data segments taken from the recording of Fig. 5).
Figure 5
Figure 5. Spatio-temporal investigation of the emergence of rhythmicity
A, electrical recordings at 3 sites along a strip according to the schema (note electrode colour codes) made before and during the emergence of rhythmical electrical activity induced by application of ACh (50 nm). Application of this IP3 mobilizing agonist first increased the frequency of STDs. Larger depolarizing activity then emerged. B, marked regions in A shown on an expanded scale (note different vertical scales for records 4–6). C, power spectral density plots showing spectral peaks for 50 s recordings commencing at a, b or c as marked in A (* vertically scaled × 10). Nifedipine (1 μm) present throughout. Vm−56 mV (NB: data of Fig. 4 taken from this recording).
Figure 6
Figure 6. Effect of store Ca2+-ATPase inhibition on SWs recorded at two sites
A, effect of CPA (10 μm) on SWs recorded in a strip at 2 sites 4.2 mm apart. CPA inhibited SWs at both recording sites to transiently reveal near synchronous underlying pacemaker potentials before complete suppression of all rhythmicity. This sequence reversed during recovery from the CPA. B, marked records in A shown on expanded time scales. C, power spectra showing presence or absence of spectral peaks for 50 s record segments commencing at the alphabetically marked positions in record A (* vertically scaled × 10). Nifedipine (1 μm) present throughout. Vm−62 mV.
Figure 7
Figure 7. Agonist-induced enhancement of synchronicity
A, SWs recorded in a strip at 2 sites 4.5 mm apart before and during application of ACh (100 nm). B, marked regions in A presented in expanded form. Nifedipine (1 μm) present throughout. Vm−58 mV.
Figure 8
Figure 8. Spatio-temporal characteristics of pacemaker potentials and regenerative SWs
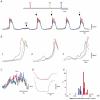
A, continuous recording of SWs recorded at 3 sites along a strip according to the schema (note electrode colour codes; electrodes are labelled el1, el2 and el3). B, expanded views of the SWs marked in A. C, expanded view of the sub-threshold pacemaker potential marked as PP1 in A. D, the average voltage responses to injection of a −4 nA current pulse through eI3 (n = 3) with superimposed numerical fits for a one dimensional core conductor using a finite cable model with τm= 0.20 s and λ= 2.8 mm. E, histogram demonstrating that SWs exhibited variable ‘CVs’ (for calculation of this parameter, see Methods) and sites of origination as shown for sequentially recorded events first appearing near site 1 (red) or site 3 (blue), the latter plotted as negative values. Nifedipine (1 μm) present throughout. Vm−61 mV.
Figure 9
Figure 9. Central interruption of intercellular connectivity decouples SWs
A, dual electrode recording at ∼1 mm separation from a 3 mm strip during global application of the gap junction blocker 18-β glycyrrhetinic acid (18-β GA; 40 μm). 18-β GA blocked both intercellular conductivity (as measured by injection of current −2 nA through eI2) and SWs. B, SWs simultaneously recorded at 2 sites along a strip before, during and after central application of 60 μm 18-β GA (see schema). C, expanded record segments marked in B. Nifedipine (1 μm) present throughout. Vm: A−63 mV, B−59 mV.
Figure 10
Figure 10. Central interruption of store Ca2+ release decouples SWs
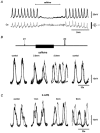
A, caffeine (0.5 mm), applied to an Oregon Green-loaded strip, blocked SWs (upper trace) and associated Ca2+ transients (lower trace). B, SWs recorded at 2 sites 6 mm apart along a strip before, during and after central application of 1 mm caffeine (see schema) applied at stream widths of 3 and 5 mm. SWs fully resynchronized upon cessation of the caffeine stream. C, SWs recorded at 2 sites 7 mm apart along a strip before and after central application of 50 μm 2-aminoethoxydiphenyl borate (2-APB) applied at stream widths of 1, 3 and 6 mm. ACh (50 nm) present throughout in C to increase SW frequency. Nifedipine (1 μm) present throughout. Vm: A−56 mV, B−67 mV, C−64 mV.
Figure 12
Figure 12. Some properties of the model-based rhythmicity
A, gradual reduction of store refill (dashed line) to 70 % of control (continuous line) inhibited rhythmicity. Rhythmicity re-emerged when store refill was returned to control levels. Higher levels of refill inhibition achieved the same result but there was proportionally larger residual depolarization (not shown). B, gradual reduction of gap junction coupling (dashed line) to no coupling (continuous line) abolished rhythmicity. Global coupling re-emerged upon return to control conditions. C, control record segment from A and histogram, taken at fixed intervals between the arrows, demonstrating that the number of store release events increased between SWs. Records in A and B show the average [Ca2+]i for the 3 colour-coded regions in the schema. Marked record segments in A and B are shown on expanded scales. The stimulus was held constant at β= 0.9 μm during these simulations. See Methods for details of the modelling and parameter values.
Figure 13
Figure 13. Role of voltage coupling in entrainment of Ca2+ stores
A, interruption of connectivity in the middle of the model strip decoupled the rhythmicities on the two sides of the strip (note colour coding). The stronger residual rhythmicity on one side of the strip arises through the relative distribution of store sensitivities, which have been randomly assigned. The simulated activity also exhibited sub-threshold pacemaker potentials (e.g. PP1). B, as for A, but now before and during central inhibition of store Ca2+ release leaving chemical and electrical connectivity intact. Inhibition of 30 cells (i.e. 3 mm) in the centre of the strip resulted in weakened decoupled rhythmicities persisting at the two strip ends at different frequencies, dependent on the distribution of IP3 sensitivities. C, as for B, but for narrower central inhibition (i.e. 1.5 mm). There was now no decoupling irrespective of duration of the central inhibition. D, rhythmical Ca2+ release and associated depolarizations present in a model strip (a) persisted when there was no diffusion of Ca2+ and IP3 between stores (b) but failed to emerge when there was Ca2+ and IP3 diffusion, but no voltage coupling to IP3 synthesis (c). The stimulus was held constant at β= 0.72 μm during all simulations. See Methods for details of the modelling and parameter values.

Similar articles

Cited by

References

    1. Allbritton NL, Meyer T, Stryer L. Range of messenger action of calcium ion and inositol 1,4,5-trisphosphate. Science. 1992;258:1812–1815. - PubMed
    1. Benham CD, Bolton TB. Spontaneous transient outward currents in single visceral and vascular smooth muscle cells of the rabbit. J Physiol. 1986;381:385–406. - PMC - PubMed
    1. Berridge MJ. Inositol trisphosphate and calcium signalling. Nature. 1993;361:315–325. - PubMed
    1. Best L, Bolton TB. Depolarisation of guinea-pig visceral smooth muscle causes hydrolysis of inositol phospholipids. Naunyn Schmiedebergs Arch Pharmacol. 1986;333:78–82. - PubMed
    1. Bootman MD, Berridge MJ, Lipp P. Cooking with calcium: the recipes for composing global signals from elementary events. Cell. 1997;91:367–373. - PubMed

Publication types

MeSH terms

LinkOut - more resources