

Disruption of 3D tissue integrity facilitates adenovirus infection by deregulating the coxsackievirus and adenovirus receptor
- PMID: 12576544
- PMCID: PMC149938
- DOI: 10.1073/pnas.0337599100
Disruption of 3D tissue integrity facilitates adenovirus infection by deregulating the coxsackievirus and adenovirus receptor
Abstract
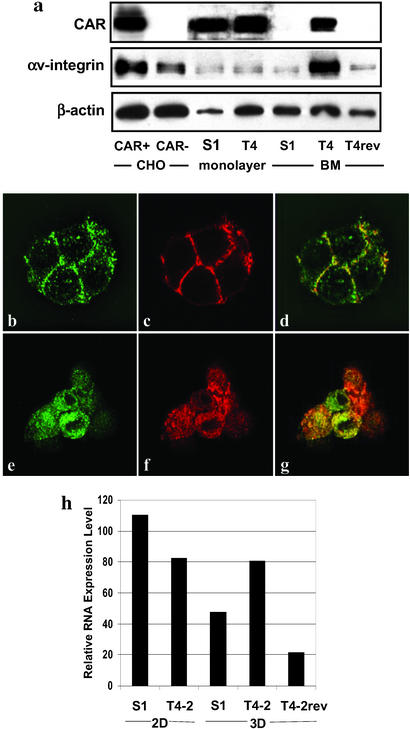
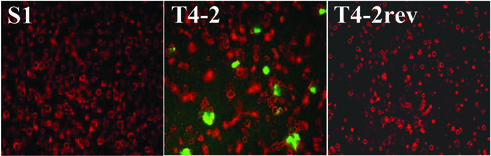
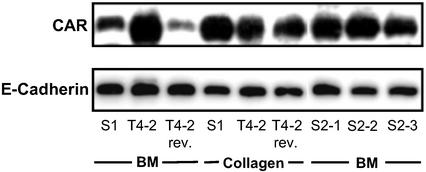
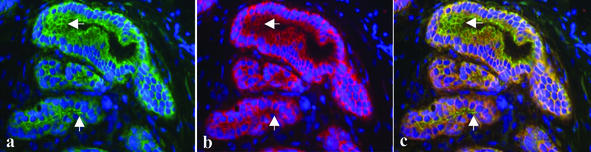
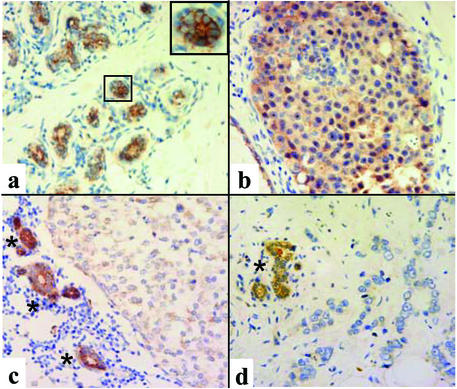
The human coxsackievirus and adenovirus receptor (CAR) represents the primary cellular site of adenovirus attachment during infection. An understanding of the mechanisms regulating its expression could contribute to improving efficacy and safety of adenovirus-based therapies. We characterized regulation of CAR expression in a 3D cell culture model of human breast cancer progression, which mimics aspects of the physiological tissue context in vitro. Phenotypically normal breast epithelial cells (S1) and their malignant derivative (T4-2 cells) were grown either on tissue culture plastic (2D) or 3D cultures in basement membrane matrix. S1 cells grown in 3D showed low levels of CAR, which was expressed mainly at cell-cell junctions. In contrast, T4-2 cells expressed high levels of CAR, which was mainly in the cytoplasm. When signaling through the epidermal growth factor receptor was inhibited in T4-2 cells, cells reverted to a normal phenotype, CAR protein expression was significantly reduced, and the protein relocalized to cell-cell junctions. Growth of S1 cells as 2D cultures or in 3D in collagen-I, a nonphysiological microenvironment for these cells, led to up-regulation of CAR to levels similar to those in T4-2 cells, independently of cellular growth rates. Thus, expression of CAR depends on the integrity and polarity of the 3D organization of epithelial cells. Disruption of this organization by changes in the microenvironment, including malignant transformation, leads to up-regulation of CAR, thus enhancing the cell's susceptibility to adenovirus infection.
Figures
References
-
- Bischoff J R, Kirn D H, Williams A, Heise C, Horn S, Muna M, Ng L, Nye J A, Sampson-Johannes A, Fattaey A, McCormick F. Science. 1996;274:373–376. - PubMed
-
- Lebedeva S, Bagdasarova S, Tyler T, Mu X, Wilson D R, Gjerset R A. Hum Gene Ther. 2001;12:763–772. - PubMed
-
- Ogawa T, Kusumoto M, Mizumoto K, Sato N, Tanaka M. Breast Cancer. 1999;6:301–304. - PubMed
-
- Bergelson J M, Cunningham J A, Droguett G, Kurt-Jones E A, Krithivas A, Hong J S, Horwitz M S, Crowell R L, Finberg R W. Science. 1997;275:1320–1323. - PubMed
-
- Hemmi S, Geertsen R, Mezzacasa A, Peter I, Dummer R. Hum Gene Ther. 1998;9:2363–2373. - PubMed
Publication types
MeSH terms
Substances
Grants and funding
LinkOut - more resources
Full Text Sources
Other Literature Sources
Research Materials
