

Activated microglia in cortex of mouse models of mucopolysaccharidoses I and IIIB
- PMID: 12576554
- PMCID: PMC149931
- DOI: 10.1073/pnas.252784899
Activated microglia in cortex of mouse models of mucopolysaccharidoses I and IIIB
Abstract
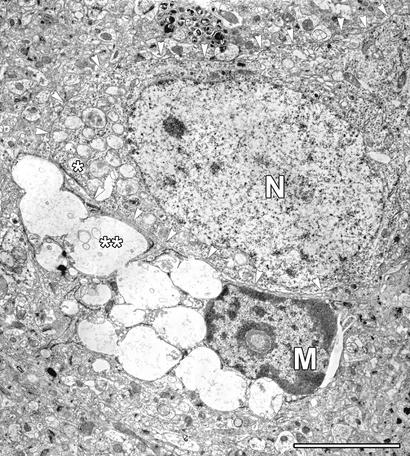
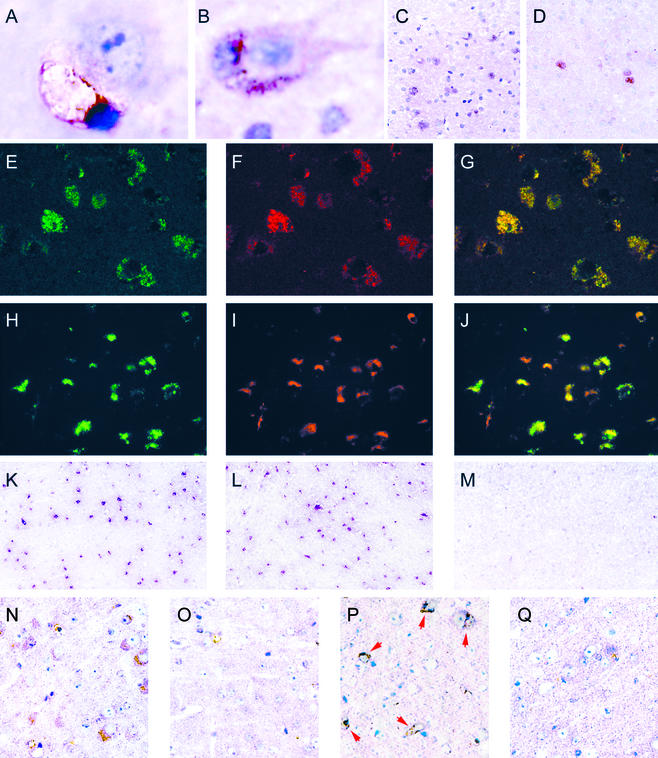
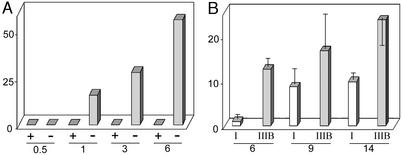
Alpha-N-acetylglucosaminidase deficiency (mucopolysaccharidosis IIIB, MPS IIIB) and alpha-l-iduronidase deficiency (MPS I) are heritable lysosomal storage diseases; neurodegeneration is prominent in MPS IIIB and in severe cases of MPS I. We have obtained morphologic and molecular evidence for the involvement of microglia in brain pathology of mouse models of the two diseases. In the cortex, a subset of microglia (sometimes perineuronal) consists of cells that are probably phagocytic; they have large storage vacuoles, react with MOMA-2 (monoclonal antibody against macrophages) and Griffonia simplicifolia isolectin IB(4), and stain intensely for the lysosomal proteins Lamp-1, Lamp-2, and cathepsin D as well as for G(M3) ganglioside. MOMA-2-positive cells appear at 1 and 6 months in MPS IIIB and MPS I mice, respectively, but though their number increases with age, they remain sparse. However, a profusion of cells carrying the macrophage CD68/macrosialin antigen appear in the cortex of both mouse models at 1 month. mRNA encoding CD68/macrosialin also increases at that time, as shown by microarray and Northern blot analyses. Ten other transcripts elevated in both mouse models are associated with macrophage functions, including complement C4, the three subunits of complement C1q, lysozyme M, cathepsins S and Z, cytochrome b558 small subunit, macrophage-specific protein 1, and DAP12. An increase in IFN-gamma and IFN-gamma receptor was observed by immunohistochemistry. These functional increases may represent activation of resident microglia, an influx and activation of blood monocytes, or both. They show an inflammatory component of brain disease in the two MPS, as is known for many neurodegenerative disorders.
Figures
References
-
- Neufeld E F, Muenzer J. In: The Metabolic and Molecular Bases of Inherited Disease. Scriver C R, Beaudet A L, Sly W S, Valle D, editors. New York: McGraw–Hill; 2001. pp. 3421–3452.
-
- Clarke L A, Russell C S, Pownall S, Warrington C L, Borowski A, Dimmick J E, Toone J, Jirik F R. Hum Mol Genet. 1997;6:503–511. - PubMed
-
- Russell C, Hendson G, Jevon G, Matlock T, Yu J, Aklujkar M, Ng K Y, Clarke L A. Clin Genet. 1998;53:349–361. - PubMed
-
- Li H H, Zhao H Z, Neufeld E F, Cai Y, Gomez-Pinilla F. J Neurosci Res. 2002;69:30–38. - PubMed
Publication types
MeSH terms
Grants and funding
LinkOut - more resources
Full Text Sources
Other Literature Sources
Molecular Biology Databases
Research Materials
Miscellaneous
