

doi: 10.1073/pnas.0438033100.
Epub 2003 Feb 10.
Loss of WAVE-1 causes sensorimotor retardation and reduced learning and memory in mice
Affiliations
- PMID: 12578964
- PMCID: PMC149900
- DOI: 10.1073/pnas.0438033100
Item in Clipboard
Loss of WAVE-1 causes sensorimotor retardation and reduced learning and memory in mice
Proc Natl Acad Sci U S A.
.
Abstract
The Scar/WAVE family of scaffolding proteins organize molecular networks that relay signals from the GTPase Rac to the actin cytoskeleton. The WAVE-1 isoform is a brain-specific protein expressed in variety of areas including the regions of the hippocampus and the Purkinje cells of the cerebellum. Targeted disruption of the WAVE-1 gene generated mice with reduced anxiety, sensorimotor retardation, and deficits in hippocampal-dependent learning and memory. These sensorimotor and cognitive deficits are analogous to the symptoms of patients with 3p-syndrome mental retardation who are haploinsufficient for WRP/MEGAP, a component of the WAVE-1 signaling network. Thus WAVE-1 is required for normal neural functioning.
Figures
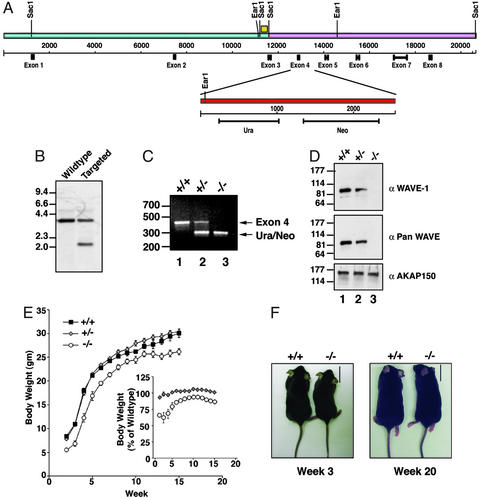
Inactivation of WAVE-1 gene and body-weight phenotype. (A) Schematic diagram of the mouse WAVE-1 gene (Upper). The location of the relevant restriction sites and exons for the WAVE-1-coding regions are indicated. The SacI genomic fragment used to generate the targeting vector (pink) is indicated. The site of homologous recombination (Lower, red) that inserted the Ura/Neo markers and deleted the exon 4–intron 5 boundary is highlighted. The yellow box marks the location of a nucleotide sequence that was used as a probe to detect homologous recombination. (B) Screening of DNA from ES cell colonies to detect homologous recombination by Southern blot analysis. Samples are indicated above each lane, and DNA sizes are indicated. (C) Genotyping of F2 progeny by PCR using primers specific for exon 4 (upper band) and the Ura/Neo markers (lower band). Samples from wild-type (+/+), heterozygous (+/−), and knockout (−/−) mice are marked above each lane, and DNA sizes are indicated. (D) WAVE protein expression in brain extracts from wild-type (+/+), heterozygous (+/−), and knockout (−/−) mice was assessed by immunoblot. Analysis of samples with WAVE-1-specific antibody (Top), pan-WAVE antibody (Middle), or unrelated AKAP150 antibody (Bottom) is presented. Molecular weight markers are indicated. (E) Body weight of wild-type (black squares), heterozygous (gray diamonds), and knockout (white circles) mice from weeks 2–15. (E Inset) The body weight of heterozygous and knockout mice expressed as a percentage of the wild-type body weight is shown. (F) Representative photographs of wild-type (+/+) and knockout (−/−) mice at weeks 3 (Left) and 20 (Right). (Scale bar, 1.7 cm.)
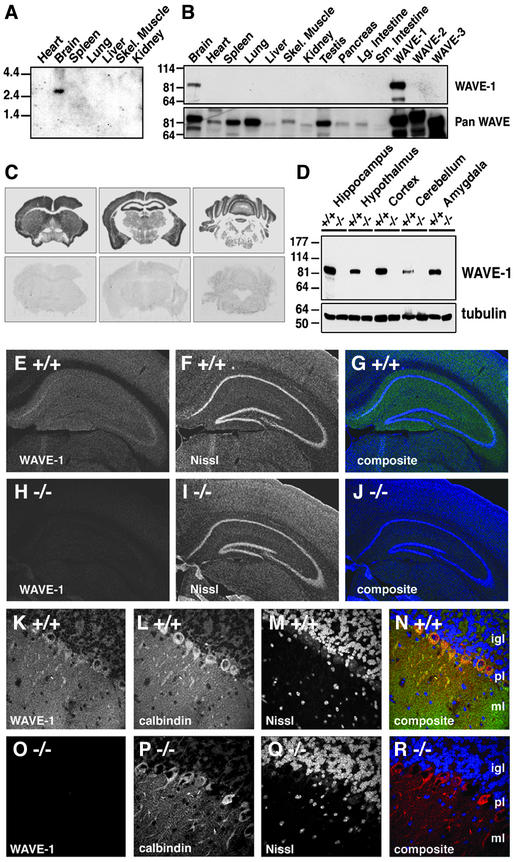
Tissue-specific expression of mouse WAVE-1. (A) Northern blot of wild-type mouse tissues (indicated above each lane) using a probe specific for WAVE-1. Size markers are indicated. (B) Immunoblot analysis of WAVE-1 protein expression using an isoform-specific antibody (Upper) and an antibody that recognizes all WAVE isoforms (Lower) in wild-type mouse tissue samples. Tissue sources are indicated above each lane. Control extracts from human embryonic kidney 293 cells expressing recombinant WAVE-1, WAVE-2, or WAVE-3 (last three lanes on the far right) demonstrate antibody selectivity. (C) In situ hybridization of coronal sections from a wild-type mouse. Hybridization with an anti-sense probe for WAVE-1 (Upper) or a sense probe (Lower) are indicated. (D Upper) Immunoblot analysis of WAVE-1 expression in specific brain regions (indicated above each lane) of wild-type (+/+) or knockout (−/−) mice. (D Lower) Tubulin expression used as a loading control. Molecular weight markers are indicated. (E–J) Immunohistochemical localization of WAVE-1 in coronal hippocampal sections from wild-type (E) or knockout (H) mice. Costaining with Nissl for wild-type (F) and knockout (I) sections is shown. Composite images of WAVE-1 (green) and Nissl (blue) staining are shown for wild-type (G) and knockout (J) sections. (K–R) Immunohistochemical localization of WAVE-1 in coronal cerebellar sections from wild-type (K) and knockout (O) mice. Costaining of Purkinje cells with calbindin (L and P) and the granule cell layer with Nissl (M and Q) are presented. Composite images of WAVE-1 (green), calbindin (red), and Nissl (blue) staining are shown for wild-type (N) and knockout (N) sections. The internal granule cell (igl), Purkinje cell (pl), and molecular (ml) layers are indicated on the composite images.
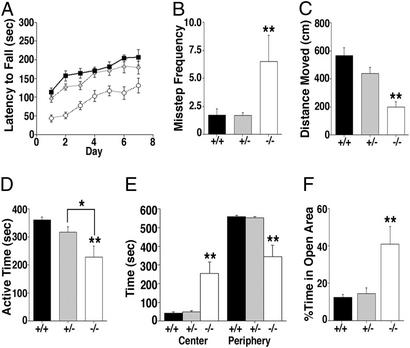
Altered sensorimotor and anxiety levels in WAVE-1 null mice. (A) Rotorod test. The latency to fall during rotarod testing (sec) of wild-type (black squares), heterozygous (gray diamonds), and knockout (white circles) mice is indicated. Mice were tested three times per day over a 7-day period. Daily group averages are represented. Although all groups improved their ability to stay on the rotating rod with training (P < 0.01), WAVE-1 knockout mice fell earlier than heterozygous and wild-type mice (P < 0.01, −/− vs. +/− and +/+, Tukey–Kramer). (B) Inclined-screen test. The frequency of missteping during the inclined-screen test is shown. WAVE-1 knockout mice (−/−) misstepped more often than heterozygous (+/−) and wild-type (+/+) mice (**, P < 0.01 −/− vs. +/− and +/+, Tukey–Kramer). (C) Balance-beam test. Distance moved on a balance beam is shown. WAVE-1 knockout mice (−/−) showed reduced sensorimotor activity as compared with heterozygous (+/−) and wild-type (+/+) mice (**, P < 0.01 −/− vs. +/− and +/+, Tukey–Kramer). (D) Open-field test. The total active time during a 10-min open-field test is presented. WAVE-1 knockout mice (−/−) were significantly less active than heterozygous (+/−) and wild-type (+/+) mice (**, P < 0.01 −/− vs. +/+, and *, P < 0.05 −/− vs. +/−, Tukey–Kramer). (E) Total time in the center and total time spent at the periphery of the open field are indicated for each genotype (marked below each group). WAVE-1 knockout (−/−) mice spent significantly more time in the center and less time in the periphery than heterozygous (+/−) and wild-type (+/+) mice (**, P < 0.01 −/− vs. +/− and +/+, Tukey–Kramer). There was a significant effect of zone in wild-type and heterozygous (P < 0.01) but not in WAVE-1 knockout (P = 0.155) mice. (F) Elevated zero maze. The percentage of time spent in the open areas of the elevated zero maze is shown. WAVE-1 knockout mice (−/−) spent significantly more time in the open areas of the zero maze than heterozygous (+/−) and wild-type (+/+) mice (**, P < 0.01 −/− vs. +/− and +/+, Tukey–Kramer). Error bars represent SEM values.

WAVE-1 null mice are impaired in spatial and nonspatial but not in emotional learning and memory. (A) Morris water maze. Time to swim to the platform (latency) was measured for wild-type (black squares), heterozygous (gray diamonds), and WAVE-1 null (white circles) mice. The mice were tested in two daily sessions of three trials each. Sessions 1–6 (Left) represent learning trials for the visible platform, and sessions 7–12 (Right) represent learning trials for the submerged hidden platform. Session averages ± SEM are represented. Although all groups learned to locate the visible platform location (P < 0.01), WAVE-1 knockout mice required significantly more time to reach the platform (P < 0.01 −/− vs. +/+ and +/−, Tukey–Kramer). In contrast, wild-type (P < 0.05) and heterozygous (P < 0.01) mice learned to locate the hidden platform, but the WAVE-1 knockout did not (P = 0.833). (B) Representative swim-path traces for wild-type (+/+), heterozygous (+/−), and knockout (−/−) mice during the probe trial (platform removed). The start position is marked by a black square, and the target area is indicated by the shaded area. (C) The percentage of time spent in target vs. nontarget areas during the probe trial for wild-type (+/+), heterozygous (+/−), and knockout (−/−) mice is indicated. The wild-type and heterozygous mice spent significantly more time in the target area than any of the nontarget areas (P < 0.01, Tukey–Kramer) than the knockout (−/−) mice. (D and E) Novel-object recognition. (D) The percentage of object-exploration time spent with the familiar and novel objects is presented. Wild-type (+/+, P < 0.01) and heterozygous (+/−, P < 0.05) mice spent a significantly greater percentage of time exploring the novel object, indicating intact object recognition. WAVE-1 knockout mice (−/−) did not spend a greater percentage of time exploring the novel object (P = 0.375). (E) The total times spent exploring both objects. Wave-1 knockout (−/−) mice spent significantly more time exploring both objects on days 4 and 5 than wild-type (+/+) and heterozygous (+/−) mice (**, P < 0.01 −/− vs. +/− and +/+, Tukey–Kramer). (F) Passive-avoidance test. The latency to enter the dark chamber on days 1 and 2 is shown. All groups took significantly longer to enter the dark chamber on day 2 than day 1, and there were no genotype differences (*, P < 0.05, and **, P < 0.01, day 2 vs. day 1).
References
Publication types
MeSH terms
Substances
Grants and funding
LinkOut - more resources
Full Text Sources
Other Literature Sources
Medical
Molecular Biology Databases
Research Materials
Miscellaneous
