

The Escherichia coli multidrug transporter MdfA catalyzes both electrogenic and electroneutral transport reactions
- PMID: 12578981
- PMCID: PMC149890
- DOI: 10.1073/pnas.0435544100
The Escherichia coli multidrug transporter MdfA catalyzes both electrogenic and electroneutral transport reactions
Abstract
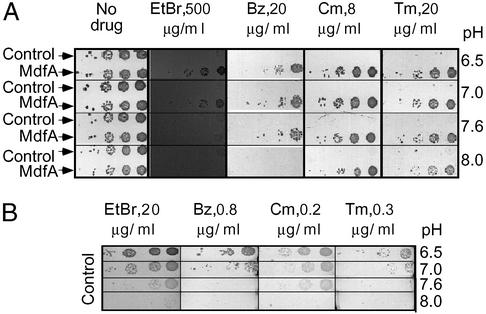
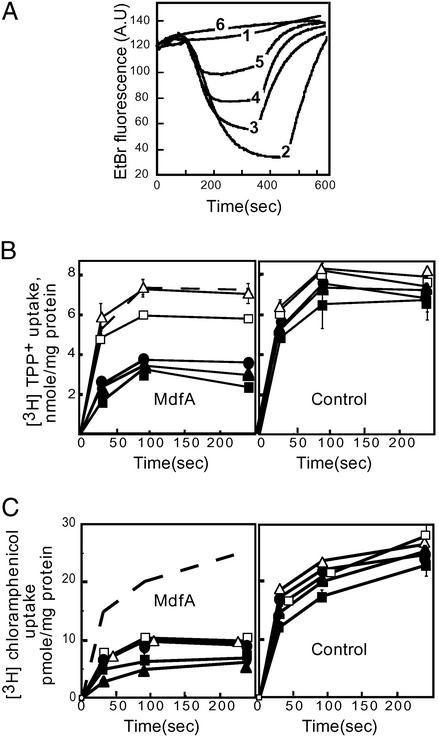
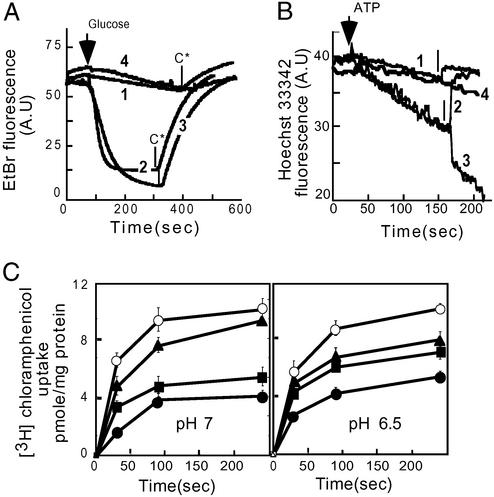
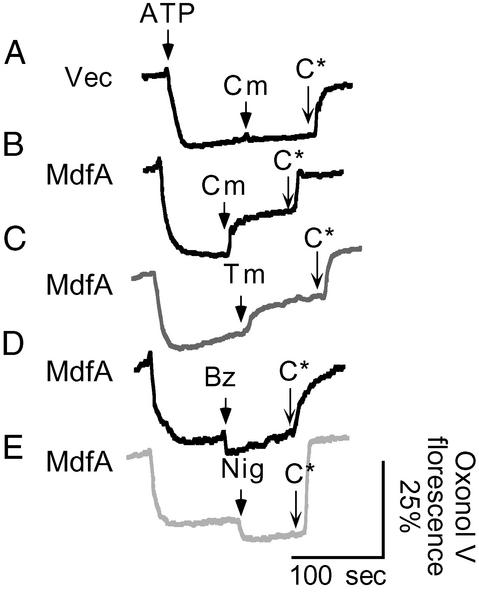
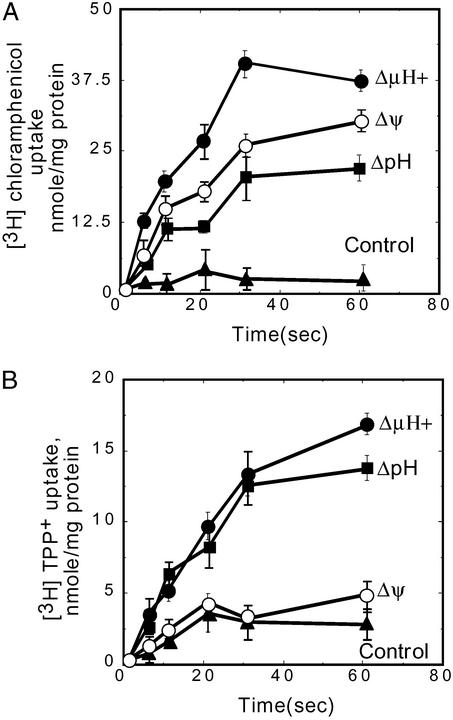
The resistance of cells to many drugs simultaneously (multidrug resistance) often involves the expression of membrane transporters (Mdrs); each recognizes and expels a broad spectrum of chemically unrelated drugs from the cell. The Escherichia coli Mdr transporter MdfA is able to transport differentially charged substrates in exchange for protons. This includes neutral compounds, namely chloramphenicol and thiamphenicol, and lipophilic cations such as tetraphenylphosphonium and ethidium. Here we show that the chloramphenicol and thiamphenicol transport reactions are electrogenic, whereas the transport of several monovalent cationic substrates is electroneutral. Therefore, unlike with positively charged substrates, the transmembrane electrical potential (negative inside) constitutes a major part of the driving force for the transport of electroneutral substrates by MdfA. These results demonstrate an unprecedented ability of a single secondary transporter to catalyze discrete transport reactions that differ in their electrogenicity and are governed by different components of the proton motive force.
Figures
Similar articles
-
A single membrane-embedded negative charge is critical for recognizing positively charged drugs by the Escherichia coli multidrug resistance protein MdfA.EMBO J. 1999 Feb 15;18(4):822-32. doi: 10.1093/emboj/18.4.822. EMBO J. 1999. PMID: 10022825 Free PMC article.
-
MdfA, an interesting model protein for studying multidrug transport.J Mol Microbiol Biotechnol. 2001 Apr;3(2):171-7. J Mol Microbiol Biotechnol. 2001. PMID: 11321570 Review.
-
Alkalitolerance: a biological function for a multidrug transporter in pH homeostasis.Proc Natl Acad Sci U S A. 2004 Sep 28;101(39):14073-8. doi: 10.1073/pnas.0405375101. Epub 2004 Sep 15. Proc Natl Acad Sci U S A. 2004. PMID: 15371593 Free PMC article.
-
Evidence for simultaneous binding of dissimilar substrates by the Escherichia coli multidrug transporter MdfA.Biochemistry. 2001 Oct 23;40(42):12612-8. doi: 10.1021/bi011040y. Biochemistry. 2001. PMID: 11601985
-
MdfA from Escherichia coli, a model protein for studying secondary multidrug transport.J Mol Microbiol Biotechnol. 2006;11(6):308-17. doi: 10.1159/000095633. J Mol Microbiol Biotechnol. 2006. PMID: 17114895 Review.
Cited by
-
Escherichia coli YqjA, a Member of the Conserved DedA/Tvp38 Membrane Protein Family, Is a Putative Osmosensing Transporter Required for Growth at Alkaline pH.J Bacteriol. 2015 Jul;197(14):2292-300. doi: 10.1128/JB.00175-15. Epub 2015 Apr 27. J Bacteriol. 2015. PMID: 25917916 Free PMC article.
-
Outward open conformation of a Major Facilitator Superfamily multidrug/H+ antiporter provides insights into switching mechanism.Nat Commun. 2018 Oct 1;9(1):4005. doi: 10.1038/s41467-018-06306-x. Nat Commun. 2018. PMID: 30275448 Free PMC article.
-
The Competitive Absorption by the Gut Microbiome Suggests the First-Order Absorption Kinetics of Caffeine.Dose Response. 2021 Aug 17;19(3):15593258211033111. doi: 10.1177/15593258211033111. eCollection 2021 Jul-Sep. Dose Response. 2021. PMID: 34421438 Free PMC article.
-
Modeling the Overproduction of Ribosomes when Antibacterial Drugs Act on Cells.Biophys J. 2016 Feb 2;110(3):743-748. doi: 10.1016/j.bpj.2015.12.016. Biophys J. 2016. PMID: 26840738 Free PMC article.
-
Ion and lipid orchestration of secondary active transport.Nature. 2024 Feb;626(8001):963-974. doi: 10.1038/s41586-024-07062-3. Epub 2024 Feb 28. Nature. 2024. PMID: 38418916 Review.
References
Publication types
MeSH terms
Substances
LinkOut - more resources
Full Text Sources
Other Literature Sources
Molecular Biology Databases
