. 2003 Feb 15;31(4):1156-63.
doi: 10.1093/nar/gkg211.

Structural transition from antiparallel to parallel G-quadruplex of d(G4T4G4) induced by Ca2+

Affiliations

Structural transition from antiparallel to parallel G-quadruplex of d(G4T4G4) induced by Ca2+

Daisuke Miyoshi et al. Nucleic Acids Res. .

Abstract

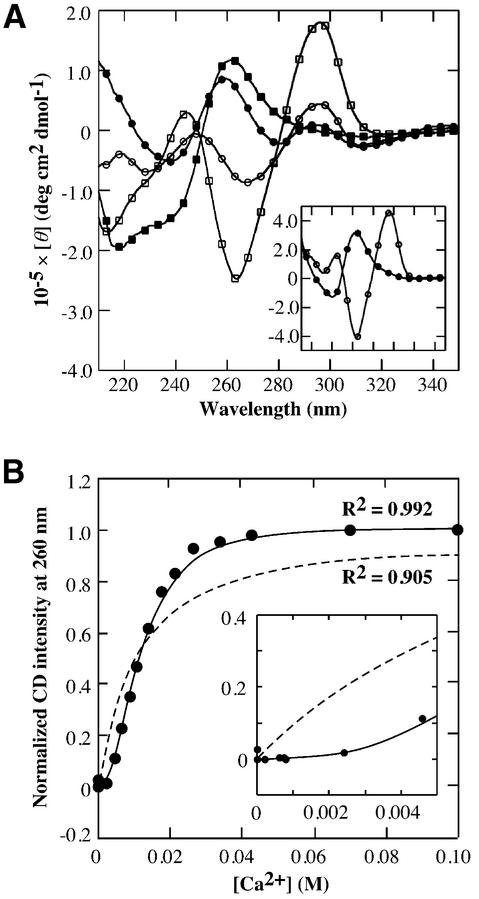
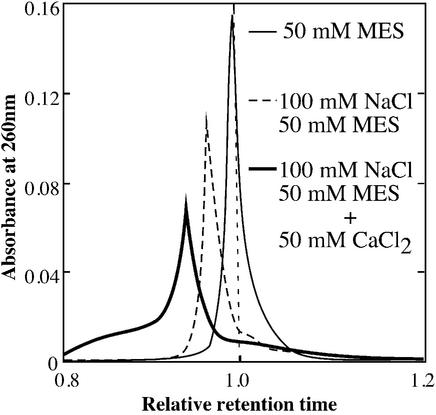
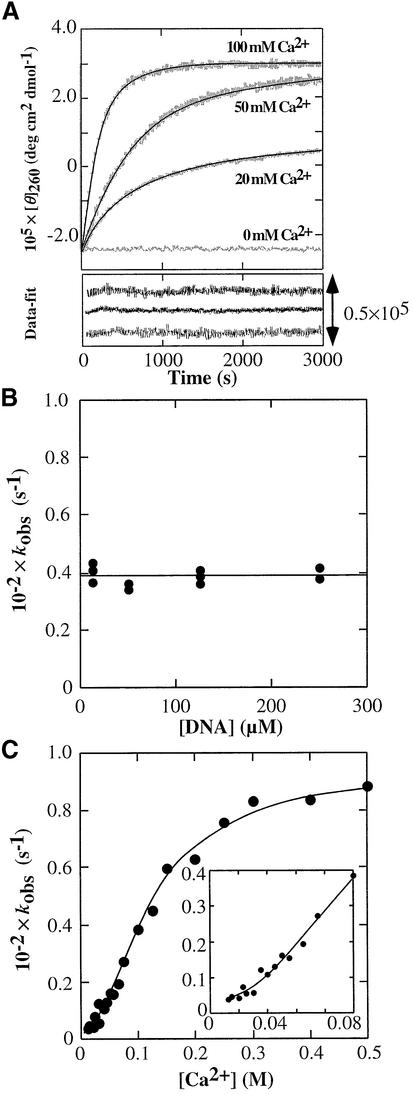
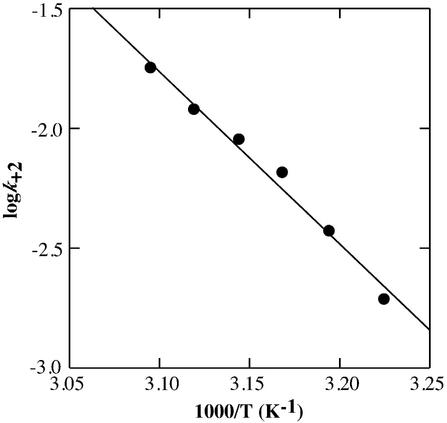
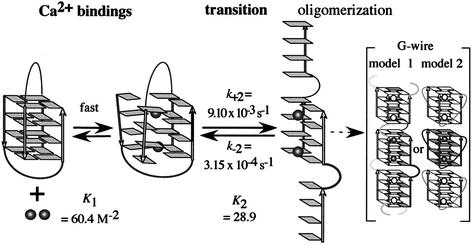
Guanine quadruplex (G-quadruplex) structures are formed by guanine-rich oligonucleotides. Because of their in vivo and in vitro importance, numerous studies have been demonstrated that the structure and stability of the G-quadruplex are dependent on the sequence of oligonucleotide and environmental conditions such as existing cations. Previously, we quantitatively investigated the divalent cation effects on the antiparallel G-quadruplex of d(G4T4G4), and found that Ca2+ induces a structural transition from the antiparallel to parallel G-quadruplex, and finally G-wire formation. In the present study, we report in detail the kinetic and thermodynamic analyses of the structural transition induced by Ca2+ using stopped-flow apparatus, circular dichroism, size-exclusion chromatography (SEC) and atomic force microscopy. The quantitative parameters showed that at least two Ca2+ ions were required for the transition. The kinetic parameters also indicated that d(G4T4G4) underwent the transition through multiple steps involving the Ca2+ binding, isomerization and oligomerization of d(G4T4G4). The parallel-stranded G-wire structure of d(G4T4G4), which is a well controlled alignment of numerous DNA strands with G-quartets, as the final product induced by Ca2+, was observed using SEC and atomic force microscopy. These results provide insight into the mechanism of the structural transition and G-wire formation and are useful for constructing a nanomaterial regulated by Ca2+.


Figures

Figure 1
Figure 1
Equilibrium analysis of the transition from the antiparallel to the parallel G-quadruplex. (A) CD spectra of 25 µM d(G4T4G4) (squares), d(G3T3G3) (circles) and d[(G4T4)3G4] (circles in the inset) in a buffer containing 100 mM NaCl, 50 mM MES (pH 6.1) with (filled symbols) or without 100 mM CaCl2 (open symbols) at 5°C. (B) Plot of normalized CD intensity d(G4T4G4) at 260 nm versus Ca2+ concentration at 5°C. Dotted and stick lines indicate best-fit results for the data with the following equations: (normalized CD intensity at 260 nm) = Ka[Ca2+]/(1 + Ka[Ca2+]) and (normalized CD intensity at 260 nm) = Ka[Ca2+]n/(1 + Ka[Ca2+]n), respectively. The best fitted value for n is calculated to be 2.11.
Figure 2
Figure 2
SEC profiles for d(G4T4G4) in buffers containing 50 mM MES (thin line), 100 mM NaCl and 50 mM MES (dotted line), and 50 mM CaCl2, 100 mM NaCl and 50 mM MES (thick line) at 25°C. These buffers were adjusted with LiOH to pH 6.1. The relative retention times in the buffers were calculated from the observed retention times of d(G4T4G4) against those for a 12mer DNA marker, d(T3C3T2CT2), which forms neither intramolecular nor intermolecular structures under these conditions. In buffer (a), the observed retention times of the marker and d(G4T4G4) were 7.71 and 7.62 min, respectively. In buffer (b), they were 8.71 and 8.32 min, respectively. In buffer (c), they were 9.89 and 9.29 min, respectively.
Figure 3
Figure 3
Kinetic properties of the transition of d(G4T4G4) from the antiparallel to the parallel G-quadruplex. (A) Kinetic traces of the transition of 25 µM d(G4T4G4) traced with CD intensity at 260 nm. Data were collected immediately after 1:1 mixing of 50 µM d(G4T4G4) and various concentrations of CaCl2. All measurements were performed in a buffer containing 100 mM NaCl and 50 mM MES (pH 6.1) at 45°C. The traces were fitted to a single exponential curve. (B) Plot of kobs at 400 mM Ca2+ at 40°C versus various concentrations of d(G4T4G4) in a buffer containing 100 mM NaCl and 50 mM MES (pH 6.1). (C) Plot of kobs of 25 µM d(G4T4G4) versus concentration of Ca2+ at 45°C in a buffer containing 100 mM NaCl and 50 mM MES (pH 6.1). The solid line indicates the best-fit result for the data using equation 2.
Figure 4
Figure 4
Arrhenius plot of log k+2 versus 1/T. The solid line is obtained with the linear least-squares fit to the data.
Figure 5
Figure 5
Schematic mechanism of the structural transition of d(G4T4G4) from antiparallel to parallel G-quadruplex induced by Ca2+. Arrows indicate the strand directions. The guanine bases of d(G4T4G4) are shown as rectangles. Thymine bases in the loop have been omitted for clarity. Disks indicate Ca2+.

References

    1. Williamson J.R., Raghuraman,M.K. and Cech,T.R. (1989) Monovalent cation-induced structure of telomeric DNA: the G-quartet model. Cell, 59, 871–880. - PubMed
    1. Basu S., Szewczak,A.A., Cocco,M. and Strobel,S.A. (2000) Direct detection of monovalent metal ion binding to a DNA G-quartet by 205Tl NMR. J. Am. Chem. Soc., 122, 3240–3245.
    1. Keniry M.A. (2001) Quadruplex structures in nucleic acids. Biopolymers, 56, 123–146. - PubMed
    1. Bock L.C., Griffin,L.C., Latham,J.A., Vermaas,E.H. and Toole,J.J. (1992) Selection of single-stranded DNA molecules that bind and inhibit human thrombin. Nature, 355, 564–566. - PubMed
    1. Williamson J.R. (1994) G-quartet structures in telomeric DNA. Annu. Rev. Biophys. Biomol. Struct. Biol., 23, 703–730. - PubMed

Publication types