Structural effect of the anticancer agent 6-thioguanine on duplex DNA
- PMID: 12582253
- PMCID: PMC150222
- DOI: 10.1093/nar/gkg203
Structural effect of the anticancer agent 6-thioguanine on duplex DNA
Abstract
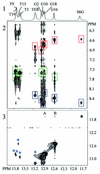
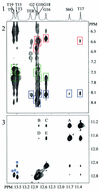
The incorporation of 6-thioguanine (S6G) into DNA is an essential step in the cytotoxic activity of thiopurines. However, the structural effects of this substitution on duplex DNA have not been fully characterized. Here, we present the solution structures of DNA duplexes containing S6G opposite thymine (S6G.T) and opposite cytosine (S6G.C), solved by high-resolution NMR spectroscopy and restrained molecular dynamics. The data indicate that both duplexes adopt right-handed helical conformations with all Watson-Crick hydrogen bonding in place. The S6G.T structures exhibit a wobble-type base pairing at the lesion site, with thymine shifted toward the major groove and S6G displaced toward the minor groove. Aside from the lesion site, the helices, including the flanking base pairs, are not highly perturbed by the presence of the lesion. Surprisingly, thermal dependence experiments suggest greater stability in the S6G-T mismatch than the S6G-C base pair.
Figures


Similar articles
-
Effect of 6-thioguanine on the stability of duplex DNA.Nucleic Acids Res. 2005 May 19;33(9):2880-6. doi: 10.1093/nar/gki572. Print 2005. Nucleic Acids Res. 2005. PMID: 15905476 Free PMC article.
-
Structure and dynamics of thioguanine-modified duplex DNA.J Biol Chem. 2003 Jan 10;278(2):1005-11. doi: 10.1074/jbc.M204243200. Epub 2002 Oct 24. J Biol Chem. 2003. PMID: 12401802
-
Solution structure of a DNA duplex containing 8-hydroxy-2'-deoxyguanosine opposite deoxyguanosine.J Mol Biol. 2003 Jan 17;325(3):433-42. doi: 10.1016/s0022-2836(02)01272-x. J Mol Biol. 2003. PMID: 12498794
-
Crystal and solution structures of d(CGC[e6G]AATTCGCG)-drug complexes reveal conformational polymorphism of O6-ethyl-guanine:cytosine base pair.Ann N Y Acad Sci. 1994 Jul 29;726:18-43; discussion 43-4. doi: 10.1111/j.1749-6632.1994.tb52794.x. Ann N Y Acad Sci. 1994. PMID: 8092675 Review.
-
Antimetabolite incorporation into DNA: structural and thermodynamic basis for anticancer activity.Biopolymers. 2002 Nov 5;65(3):180-9. doi: 10.1002/bip.10214. Biopolymers. 2002. PMID: 12228923 Review.
Cited by
-
Steric and electrostatic effects at the C2 atom substituent influence replication and miscoding of the DNA deamination product deoxyxanthosine and analogs by DNA polymerases.J Mol Biol. 2009 Sep 18;392(2):251-69. doi: 10.1016/j.jmb.2009.07.019. Epub 2009 Jul 14. J Mol Biol. 2009. PMID: 19607842 Free PMC article.
-
Thermodynamic and structural contributions of the 6-thioguanosine residue to helical properties of RNA.Sci Rep. 2019 Mar 13;9(1):4385. doi: 10.1038/s41598-019-40715-2. Sci Rep. 2019. PMID: 30867505 Free PMC article.
-
In vitro replication and thermodynamic studies of methylation and oxidation modifications of 6-thioguanine.Nucleic Acids Res. 2007;35(11):3693-704. doi: 10.1093/nar/gkm247. Epub 2007 May 21. Nucleic Acids Res. 2007. PMID: 17517786 Free PMC article.
-
Structures of a DNA Polymerase Inserting Therapeutic Nucleotide Analogues.Chem Res Toxicol. 2017 Nov 20;30(11):1993-2001. doi: 10.1021/acs.chemrestox.7b00173. Epub 2017 Sep 1. Chem Res Toxicol. 2017. PMID: 28862449 Free PMC article.
-
Solution structure and stability of the DNA undecamer duplexes containing oxanine mismatch.Nucleic Acids Res. 2012 Feb;40(4):1841-55. doi: 10.1093/nar/gkr872. Epub 2011 Oct 27. Nucleic Acids Res. 2012. PMID: 22039100 Free PMC article.
References
-
- Elion G.B. (1989) The purine path to chemotherapy. Science, 244, 41–47. - PubMed
-
- Krynetskaia N.F., Feng,J.Y., Krynetski,E.Y., Garcia,J.V., Panetta,J.C., Anderson,K.S. and Evans,W.E. (2001) Deoxythioguanosine triphosphate impairs HIV replication: a new mechanism for an old drug. FASEB Journal, 15, 1902–1908. - PubMed
-
- Lepage G.A. (1963) Basic biochemical effects and mechanism of action of 6-thioguanine. Cancer Res., 23, 1202–1206. - PubMed
-
- Maybaum J. and Mandel,H.G. (1983) Unilateral chromatid damage: a new basis for 6-thioguanine cytotoxicity. Cancer Res., 43, 3852–3856. - PubMed
-
- Pan B.F. and Nelson,J.A. (1990) Characterization of the DNA damage in 6-thioguanine-treated cells. Biochem. Pharmacol., 40, 1063–1069. - PubMed

