. 2003 Feb 15;31(4):e18.
doi: 10.1093/nar/gng018.

Identification and removal of contaminating fluorescence from commercial and in-house printed DNA microarrays

Affiliations

Identification and removal of contaminating fluorescence from commercial and in-house printed DNA microarrays

M Juanita Martinez et al. Nucleic Acids Res. .

Abstract

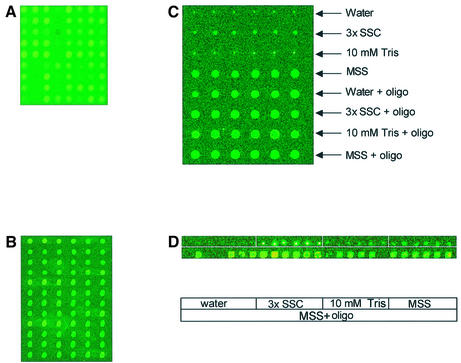
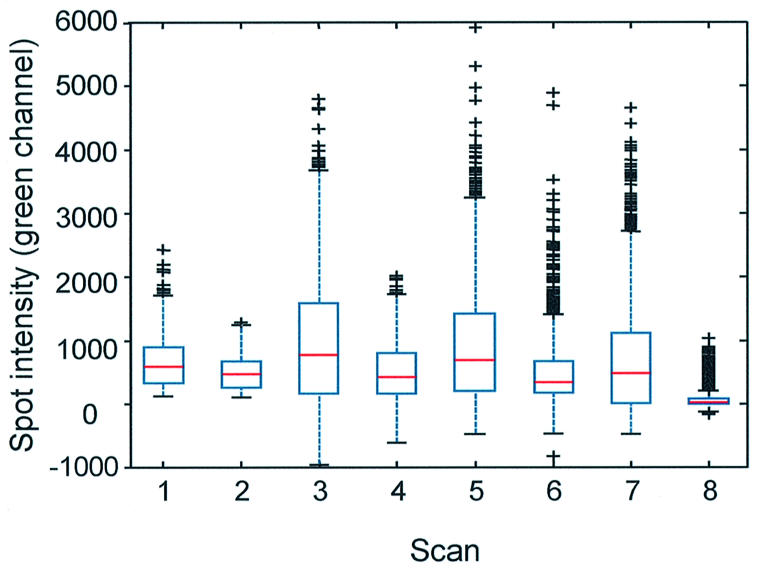
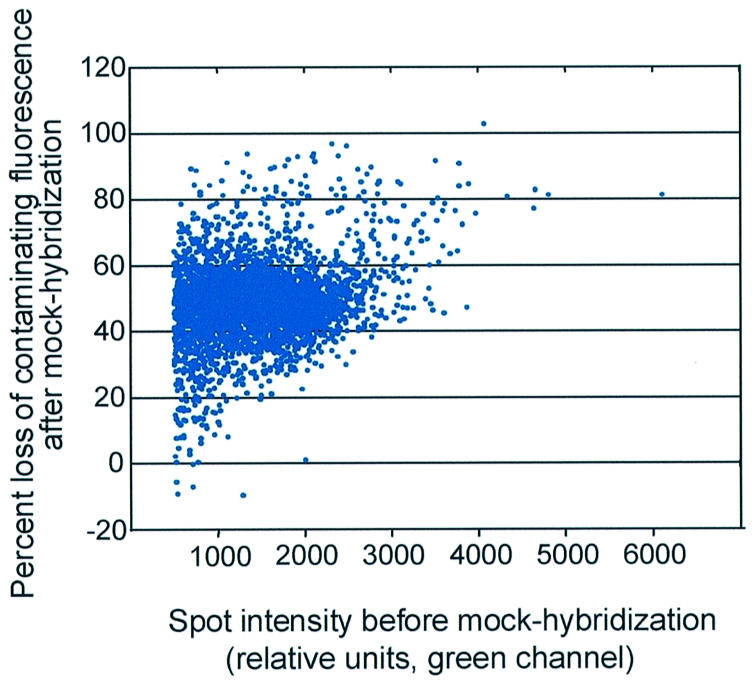
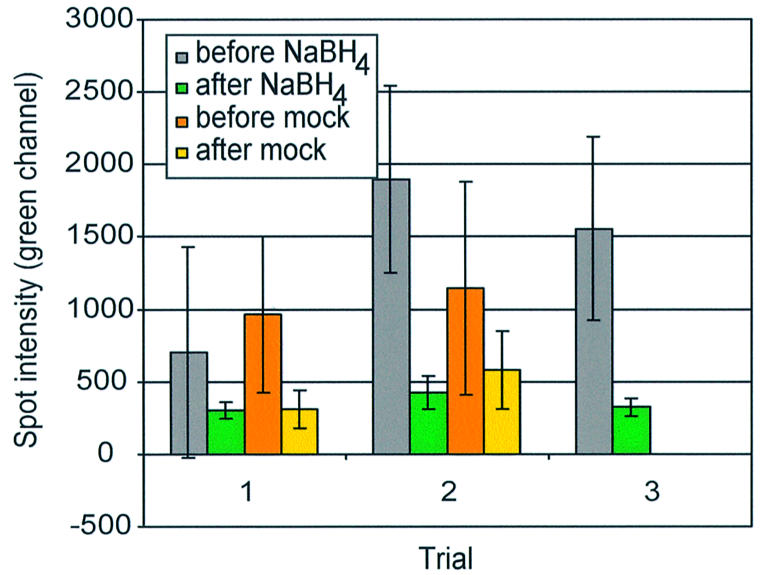
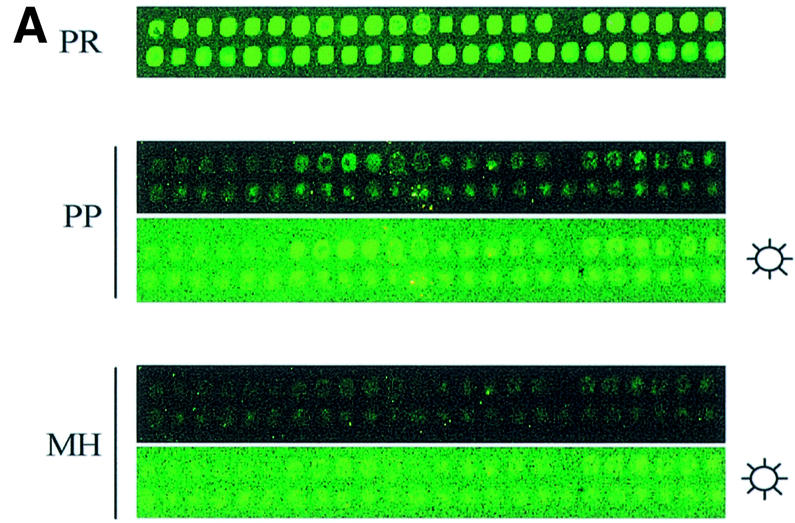
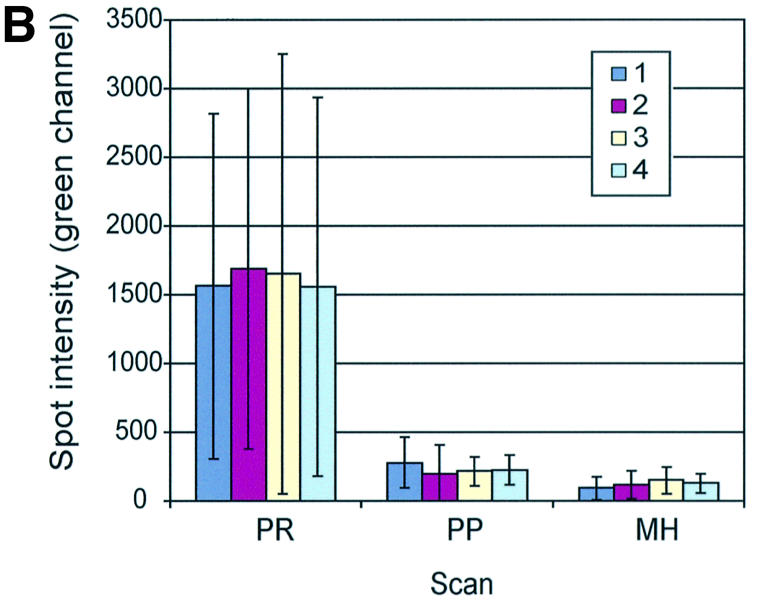
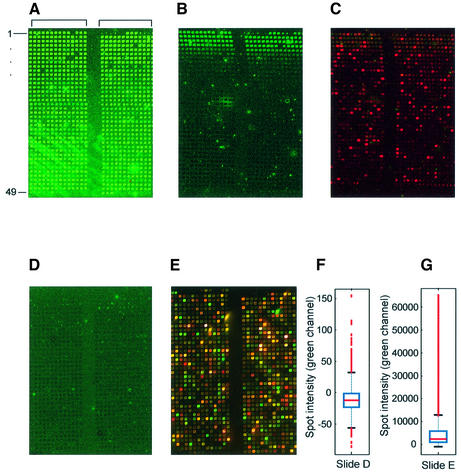
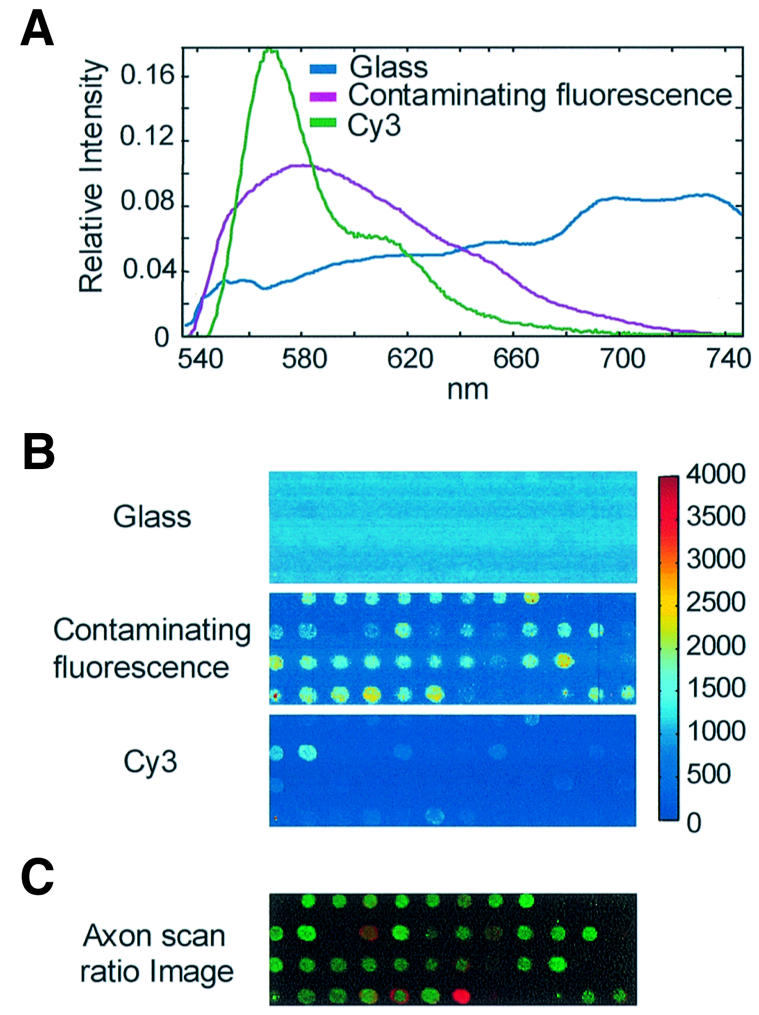
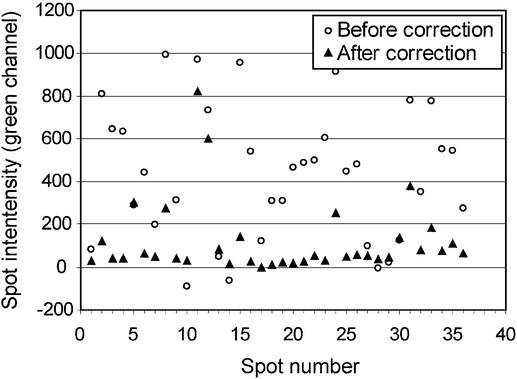
Microarray analysis is a critically important technology for genome-enabled biology, therefore it is essential that the data obtained be reliable. Current software and normalization techniques for microarray analysis rely on the assumption that fluorescent background within spots is essentially the same throughout the glass slide and can be measured by fluorescence surrounding the spots. This assumption is not valid if background fluorescence is spot-localized. Inaccurate estimates of background fluorescence under the spot create a source of error, especially for low expressed genes. We have identified spot-localized, contaminating fluorescence in the Cy3 channel on several commercial and in-house printed microarray slides. We determined through mock hybridizations (without labeled target) that pre-hybridization scans could not be used to predict the contribution of this contaminating fluorescence after hybridization because the change in spot-to-spot fluorescence after hybridization was too variable. Two solutions to this problem were identified. First, allowing 4 h of exposure to air prior to printing on to Corning UltraGAPS slides significantly reduced contaminating fluorescence intensities to approximately the value of the surrounding glass. Alternatively, application of a novel, hyperspectral imaging scanner and multivariate curve resolution algorithms, allowed the spectral contributions of Cy3 signal, glass, and contaminating fluorescence to be distinguished and quantified after hybridization.


Figures

Figure 1
Figure 1
Spot-localized, contaminating fluorescence, detected only in the green channel, is present on both commercial and in-house printed microarrays. (A) Corning preprinted array (CMT12015426 yeast S288C v. 1.32, lot 28300001), and (B) OpArray YC2A35 (Operon) were scanned immediately after opening their original packaging. (C) Corning GAPS I aminosilane coated glass slides and (D) ArrayIt superamine coated glass slides (TeleChem) were spotted with water, 3× SSC, 10 mM Tris, or Micro Spotting Solution (MSS) with or without 70mer oligonucleotides (oligo) resuspended to 40 µM. No spot-localized fluorescence was detected in the red channel.
Figure 2
Figure 2
Spot-localized, contaminating fluorescence in the green channel on commercially printed arrays is highly variable and incompletely removed after mock-hybridization. Shown are box-plots of contaminating fluorescence intensities after background subtraction. One OpArray slide (Operon) (with 450 spots) was scanned before (scan 1) and after (scan 2) mock- hybridization. Two slides (Corning) (with 6174 spots, from lot 28300001) were analyzed before (scans 3 and 5) and after mock-hybridization (scans 4 and 6). One slide (Corning) from lot 27600002 was scanned before (scan 7) and after (scan 8) mock-hybridization. The upper and lower lines of one box indicate the 25th and 75th percentile, respectively, of the sample of spot intensities for one slide scan. The red line within the box indicates the sample median. The extent of the lines above and below the box indicate the upper and lower limits of the sample except for outliers, which are indicated by crosses. A spot intensity is considered an outlier if it has a value of 1.5 times the interquartile range (distance between top and bottom of the box) away from the top or bottom of the box.
Figure 3
Figure 3
Contaminating fluorescence after hybridization cannot be accurately predicted by pre-hybridization scans. Spots from a commercial microarray slide (CMT12015426, lot 28300001, Corning) were quantified before and after mock-hybridization. Spot intensity was calculated as (median pixel intensity – median background pixel intensity) for the green channel (532 nm). Percent loss of contaminating fluorescence was calculated as [1 – (spot intensity after treatment/spot intensity before treatment)] × 100%. The spot intensity before treatment was graphed relative to the % loss of contaminating fluorescence. Only those spots with intensities >500 (after background subtraction), for the green channel before treatment, were included in this graph (n = 3933).
Figure 4
Figure 4
Contaminating fluorescence of commercial slides is partially removed by an aqueous solution in the presence or absence of sodium borohydride. CMT slides were scanned before (gray and orange bars) and after (green and yellow bars) treatment. Sodium borohydride treatment (gray and green bars) and a mock-sodium borohydride treatment (orange and yellow bars) were performed concurrently for each of two trials. A third trial without a mock-treated control is shown.
Figure 5
Figure 5
Post-printing treatment removes some but not all spot-localized, contaminating fluorescence of in-house printed arrays. (A) Yeast 70mer oligonucleotides (Operon) were spotted in ArrayIt Micro Spotting Solution (TeleChem) on GAPS I amino-silane slides and given a post-printing treatment as described in Materials and Methods. Contaminating fluorescence was visualized and quantified after print (PR), post-printing treatment (PP) and mock-hybridization (MH). Sun symbol denotes panel where brightness and contrast were adjusted to visualize the spots. (B) Spot intensities (median pixel intensity – median background pixel intensity) for each of four arrays (arrays 1–4) were averaged and graphed with standard deviations (n = 96 per array).
Figure 5
Figure 5
Post-printing treatment removes some but not all spot-localized, contaminating fluorescence of in-house printed arrays. (A) Yeast 70mer oligonucleotides (Operon) were spotted in ArrayIt Micro Spotting Solution (TeleChem) on GAPS I amino-silane slides and given a post-printing treatment as described in Materials and Methods. Contaminating fluorescence was visualized and quantified after print (PR), post-printing treatment (PP) and mock-hybridization (MH). Sun symbol denotes panel where brightness and contrast were adjusted to visualize the spots. (B) Spot intensities (median pixel intensity – median background pixel intensity) for each of four arrays (arrays 1–4) were averaged and graphed with standard deviations (n = 96 per array).
Figure 6
Figure 6
Increased time of slide exposure to atmosphere decreases retention of contaminating fluorescence but not hybridizable DNA after post-printing treatment. The S.cerevisiae genome 70mers set (Operon) in ArrayIt Micro Spotting Solution (TeleChem) was printed in-house on UltraGaps amino-silane (Corning) slides. A representative section spanning two pin groups (bracketed) is shown for each scan. Scans were done at PMT settings of 600, 600 for the red and green channels, respectively, unless noted. (A) Slide scanned immediately after printing. (B) Slide scanned after post-printing treatment. (C) Same slide as in (B) hybridized with random 9mers (Panomer Alexa 647, Molecular Probes) (PMT = 800, 550). (D) Slide ‘aged’ 4 h before print and then post-print treated. (E) Same slide as (D) hybridized with Cy3- and Cy5-labeled target reverse transcribed from 20 µg yeast total RNA (PMT = 570, 470). (F) Box-plot (see Fig. 2) of quantified spot intensities of scan shown in (D). (G) Box-plot of quantified spot intensities of a scan (PMT = 600, 600) of slide shown in (E).
Figure 7
Figure 7
Hyperspectral scan results of a hybridized Corning preprinted array showing contaminating fluorescence in the presence of Cy3. Regions of a Cy3- and Cy5-cDNA hybridized Corning preprinted DNA microarray were scanned with both the hyperspectral imaging and the Axon 4000B scanners at 10 µm spatial resolution. The spectra and concentration maps were generated from multivariate image analysis of hyperspectral images containing 46800 spectra from a 3.9 × 2.3 mm area. Each image is scaled proportional to the total intensity of the Axon 4000B ratio image for visual comparison. The appropriate scale factors were calculated by multiplying each spectrum times its concentration map and applying a filter function similar to the optical filter used on the commercial scanner (Axon). (A) Emission spectra of fluorescent species, normalized to unit length. These fluorescent emissions would all be confounded in the green channel of commercial microarray scanners. (B) Corresponding concentration maps of fluorescent species. (C) Ratio image of same area of the same slide collected on an Axon 4000B scanner and visualized with GenePix Pro.
Figure 8
Figure 8
Fluorescence intensities before and after the removal of contaminating fluorescence from Cy3 emission intensity by hyperspectral imaging and MCR. The intensities in the green channel of 36 spots of a hybridized slide (lower three rows as visualized in Fig. 7B and C) were plotted before and after MCR correction.

References

    1. Shalon D., Smith,S.J. and Brown,P.O. (1996) A DNA microarray system for analyzing complex DNA samples using two-color fluorescent probe hybridization. Genome Res., 6, 639–645. - PubMed
    1. Schena M., Shalon,D., Davis,R.W. and Brown,P.O. (1995) Quantitative monitoring of gene expression patterns with a complementary DNA microarray. Science, 270, 467–470. - PubMed
    1. Quackenbush J. (2001) Computational analysis of microarray data. Nature Rev. Genet., 2, 418–427. - PubMed
    1. Brenner S., Johnson,M., Bridgham,J., Golda,G., Lloyd,D.H., Johnson,D., Luo,S.J., McCurdy,S., Foy,M., Ewan,M. et al. (2000) Gene expression analysis by massively parallel signature sequencing (MPSS) on microbead arrays. Nat. Biotechnol., 18, 630–634. - PubMed
    1. Li X.M., Gu,W.K., Mohan,S. and Baylink,D.J. (2002) DNA microarrays: their use and misuse. Microcirculation, 9, 13–22. - PubMed

Publication types

MeSH terms