

Combining quantitative trait Loci analysis and an ecophysiological model to analyze the genetic variability of the responses of maize leaf growth to temperature and water deficit
- PMID: 12586890
- PMCID: PMC166842
- DOI: 10.1104/pp.013839
Combining quantitative trait Loci analysis and an ecophysiological model to analyze the genetic variability of the responses of maize leaf growth to temperature and water deficit
Abstract
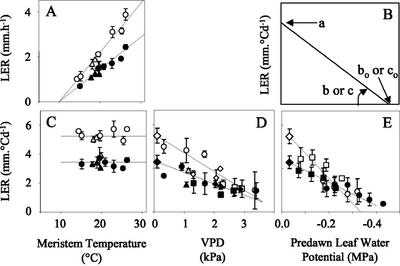
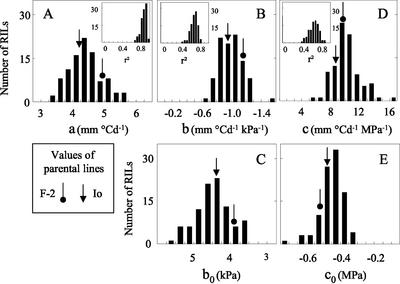
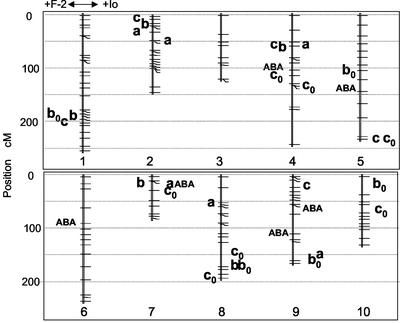
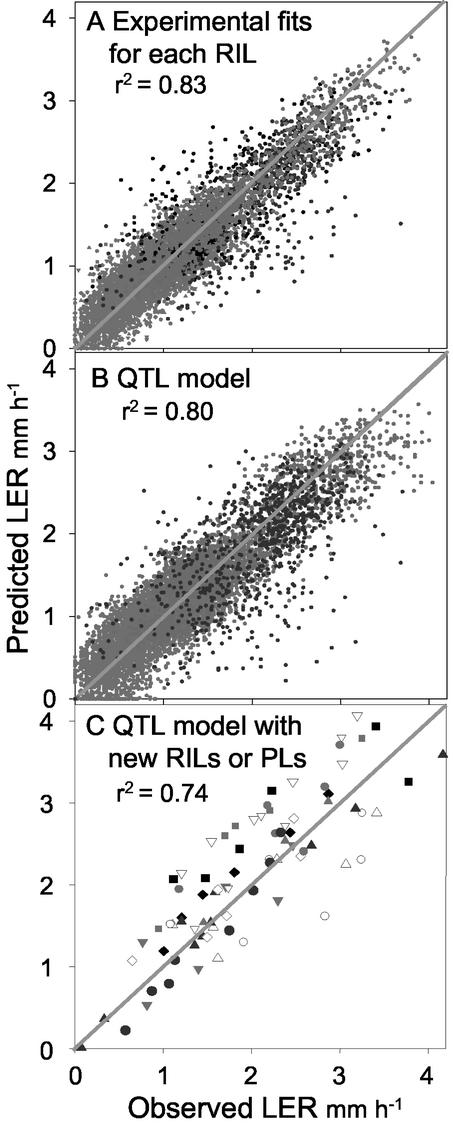
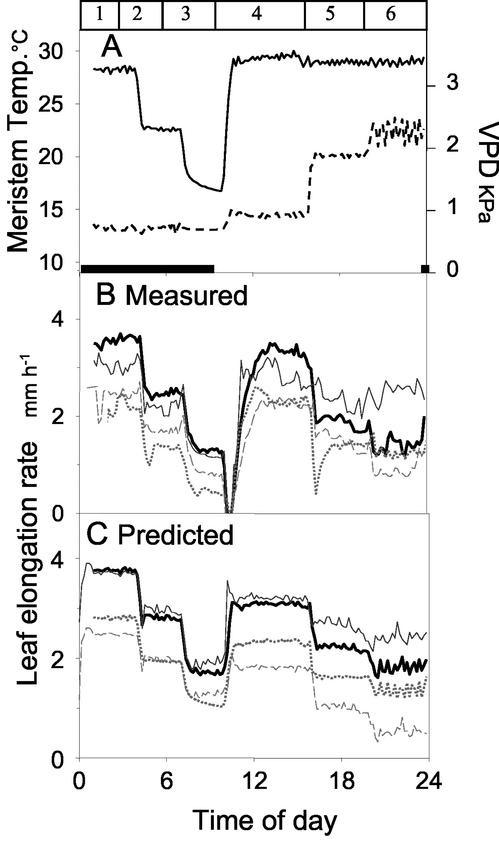
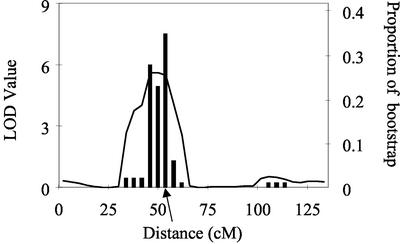
Ecophysiological models predict quantitative traits of one genotype in any environment, whereas quantitative trait locus (QTL) models predict the contribution of alleles to quantitative traits under a limited number of environments. We have combined both approaches by dissecting into effects of QTLs the parameters of a model of maize (Zea mays) leaf elongation rate (LER; H. Ben Haj Salah, F. Tardieu [1997] Plant Physiol 114: 893-900). Response curves of LER to meristem temperature, water vapor pressure difference, and soil water status were established in 100 recombinant inbred lines (RILs) of maize in six experiments carried out in the field or in the greenhouse. All responses were linear and common to different experiments, consistent with the model. A QTL analysis was carried out on the slopes of these responses by composite interval mapping confirmed by bootstrap analysis. Most QTLs were specific of one response only. QTLs of abscisic acid concentration in the xylem sap colocalized with QTLs of response to soil water deficit and conferred a low response. Each parameter of the ecophysiological model was computed as the sum of QTL effects, allowing calculation of parameters for 11 new RILs and two parental lines. LERs were simulated and compared with measurements in a growth chamber experiment. The combined model accounted for 74% of the variability of LER, suggesting that it has a general value for any RIL under any environment.
Figures

Similar articles
-
Are source and sink strengths genetically linked in maize plants subjected to water deficit? A QTL study of the responses of leaf growth and of Anthesis-Silking Interval to water deficit.J Exp Bot. 2007;58(2):339-49. doi: 10.1093/jxb/erl227. Epub 2006 Nov 27. J Exp Bot. 2007. PMID: 17130185
-
Dealing with the genotype x environment interaction via a modelling approach: a comparison of QTLs of maize leaf length or width with QTLs of model parameters.J Exp Bot. 2004 Nov;55(407):2461-72. doi: 10.1093/jxb/erh200. Epub 2004 Jul 30. J Exp Bot. 2004. PMID: 15286140
-
Are ABA, ethylene or their interaction involved in the response of leaf growth to soil water deficit? An analysis using naturally occurring variation or genetic transformation of ABA production in maize.Plant Cell Environ. 2006 Sep;29(9):1829-40. doi: 10.1111/j.1365-3040.2006.01560.x. Plant Cell Environ. 2006. PMID: 16913872
-
QTLs for the elongation of axile and lateral roots of maize in response to low water potential.Theor Appl Genet. 2010 Feb;120(3):621-31. doi: 10.1007/s00122-009-1180-5. Epub 2009 Oct 22. Theor Appl Genet. 2010. PMID: 19847387
-
Simulating the yield impacts of organ-level quantitative trait loci associated with drought response in maize: a "gene-to-phenotype" modeling approach.Genetics. 2009 Dec;183(4):1507-23. doi: 10.1534/genetics.109.105429. Epub 2009 Sep 28. Genetics. 2009. PMID: 19786622 Free PMC article.
Cited by
-
Plant response to environmental conditions: assessing potential production, water demand, and negative effects of water deficit.Front Physiol. 2013 Feb 18;4:17. doi: 10.3389/fphys.2013.00017. eCollection 2013. Front Physiol. 2013. PMID: 23423357 Free PMC article.
-
RADIX: rhizoslide platform allowing high throughput digital image analysis of root system expansion.Plant Methods. 2016 Sep 5;12(1):40. doi: 10.1186/s13007-016-0140-8. eCollection 2016. Plant Methods. 2016. PMID: 27602051 Free PMC article.
-
Integration of Crop Growth Models and Genomic Prediction.Methods Mol Biol. 2022;2467:359-396. doi: 10.1007/978-1-0716-2205-6_13. Methods Mol Biol. 2022. PMID: 35451783
-
Are the common assimilate pool and trophic relationships appropriate for dealing with the observed plasticity of grapevine development?Ann Bot. 2010 Feb;105(2):233-47. doi: 10.1093/aob/mcp278. Epub 2009 Nov 27. Ann Bot. 2010. PMID: 19946042 Free PMC article.
-
Genetic Architecture of Flowering Phenology in Cereals and Opportunities for Crop Improvement.Front Plant Sci. 2016 Dec 19;7:1906. doi: 10.3389/fpls.2016.01906. eCollection 2016. Front Plant Sci. 2016. PMID: 28066466 Free PMC article. Review.
References
Publication types
MeSH terms
Substances
LinkOut - more resources
Full Text Sources
Other Literature Sources
Miscellaneous
