. 2003 Feb 14;299(5609):1073-5.
doi: 10.1126/science.1080425.

Contrast tuning in auditory cortex

Affiliations

Contrast tuning in auditory cortex

Dennis L Barbour et al. Science. .

Abstract

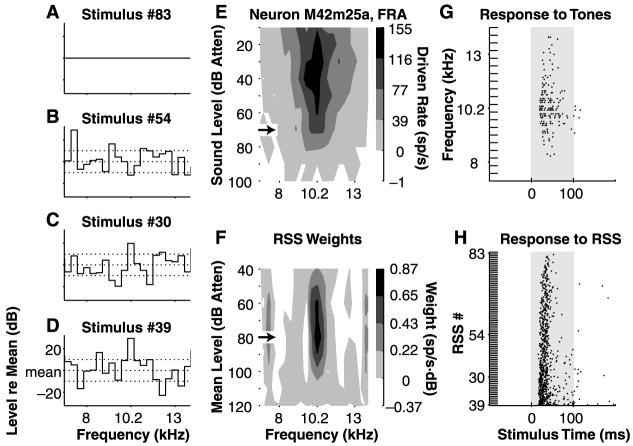
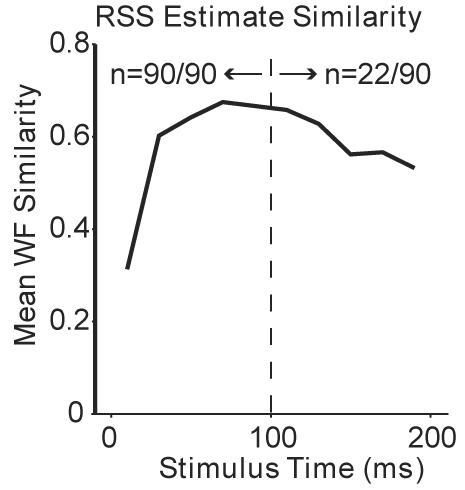
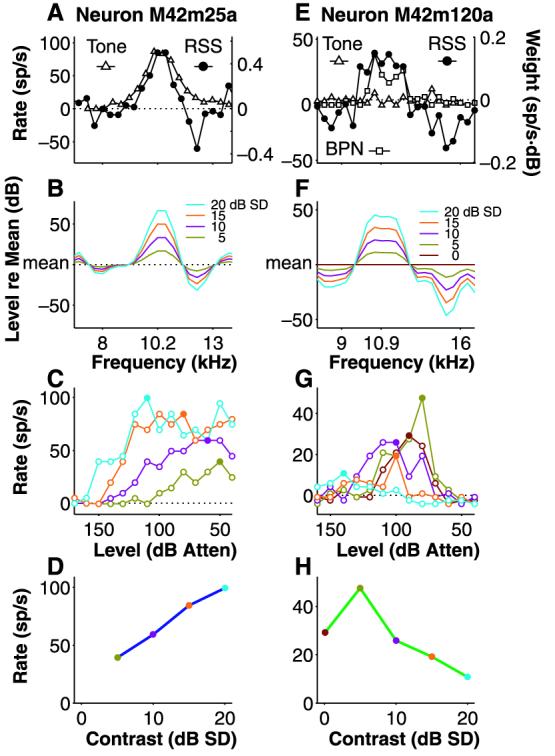
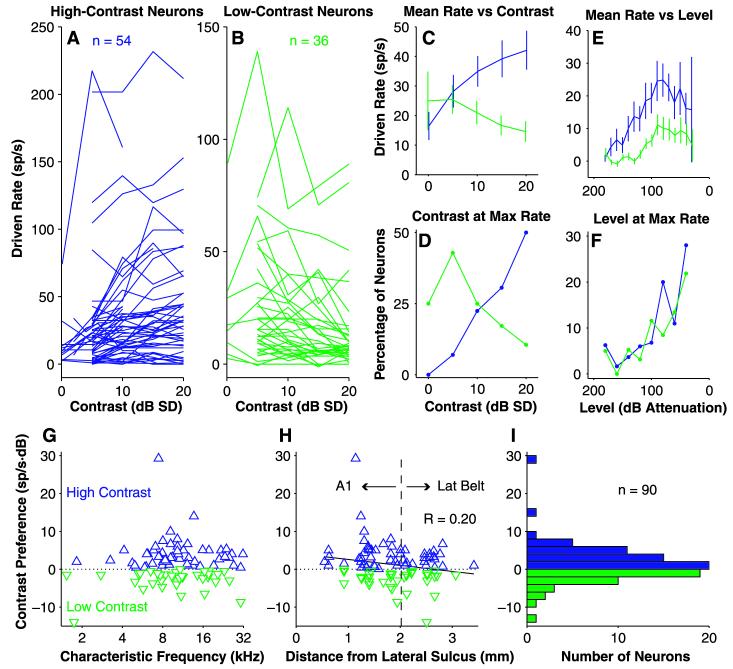
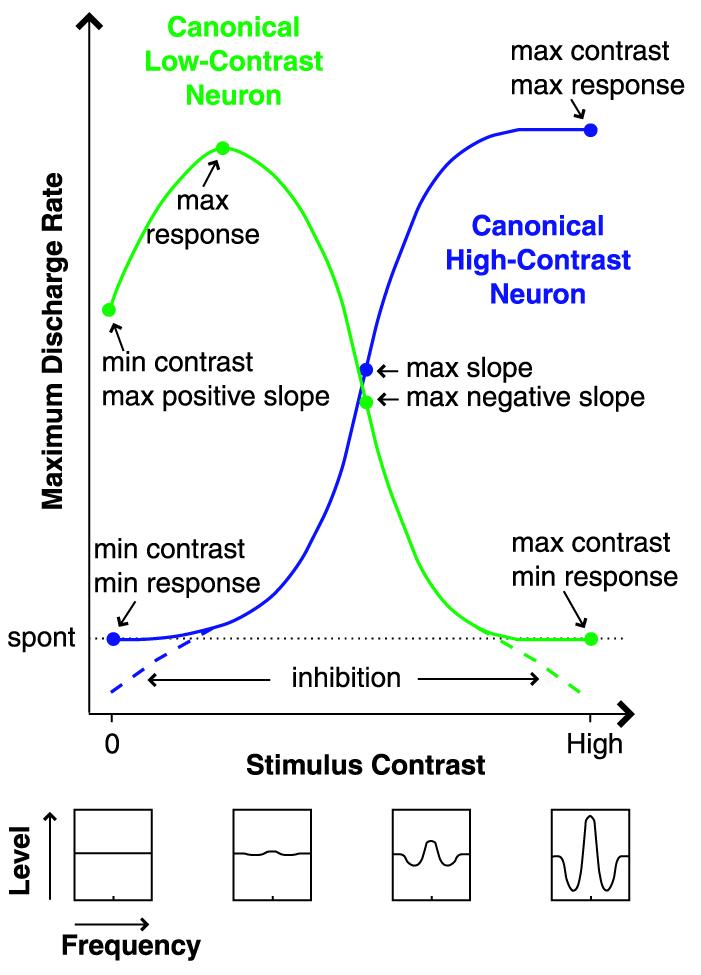
The acoustic features useful for converting auditory information into perceived objects are poorly understood. Although auditory cortex neurons have been described as being narrowly tuned and preferentially responsive to narrowband signals, naturally occurring sounds are generally wideband with unique spectral energy profiles. Through the use of parametric wideband acoustic stimuli, we found that such neurons in awake marmoset monkeys respond vigorously to wideband sounds having complex spectral shapes, preferring stimuli of either high or low spectral contrast. Low contrast-preferring neurons cannot be studied thoroughly with narrowband stimuli and have not been previously described. These findings indicate that spectral contrast reflects an important stimulus decomposition in auditory cortex and may contribute to the recognition of acoustic objects.


Figures

Fig. 1
Fig. 1
Responses to RSS. (A to D) Four RSS in a set containing 83 stimuli with spectral contrast of 10 dB SD (dotted lines). (E) FRA of AC neuron computed with pure tones of differing level/frequency combinations. Driven rate is computed over entire stimulus duration. Atten, attenuation; sp, spikes. (F) RSS WFs were computed at various mean sound levels from 83 stimuli. Shape but not magnitude of WF remains constant. (G and H) Raster plots of action potentials (spikes) in response to tones at 70 dB attenuation and to RSS at 80 dB attenuation (arrows in E and F). Shaded areas represent stimulus duration.
Fig. 2
Fig. 2
WF shape remains relatively constant throughout stimulus duration. Shown is mean WF similarity ≤ 100 ms (n = 90 neurons) and > 100 ms (n = 22 neurons).
Fig. 3
Fig. 3
Two opposite responses to spectral contrast. (A) Tuning of the neuron in Fig. 1 to tones (△) as compared with RSS WF (●). (B) The WF was converted into OLS over several spectral contrast values (5 to 20 dB SD). Stimulus spectra were smoothed for illustration only. (C) Rate-level response curves for the four stimuli in (B). Lowest contrast elicited least response; highest contrast, greatest. Threshold shifts commonly occur as contrast is varied. (D) The peak rates from the rate-level curves in (C) (filled symbols) are plotted against stimulus contrast to produce a monotonic rate-contrast curve. (E) Tuning of another neuron to tones (△), 0.4-octave BPN (□), and RSS WF (●). (F) Smoothed spectra of OLS at contrast values of 0 to 20 dB SD. (G) Rate-level curves showing decreased responsiveness at the highest contrasts. (H) Rate-contrast curve revealing nonmono-tonic characteristics.
Fig. 4
Fig. 4
Population responses to spectral contrast. (A and B) Rate-contrast curves for 54 high- (blue) and 36 low- (green) contrast neurons. (C) Mean rate-contrast curves for high- and low-contrast neurons. Error bars show standard error of the mean (SEM). (D) Percentage of neurons whose rate-contrast peaks occurred at the given contrast values. (E) Mean ± SEM rate-level curves showing lower thresholds and higher rates for high- than for low-contrast neurons but similar shapes. (F) Percentage of neurons whose rate-level peaks occurred at the given sound levels. Magnitude of contrast preference (max absolute rate-contrast slope with sign preserved) are shown as a function of (G) CF and (H) orthogonal distance lateral to the lateral sulcus and (I) as a histogram.
Fig. 5
Fig. 5
Canonical responses to spectral contrast. This coding scheme reflects complex multifrequency signal integration that cannot be predicted from frequency tuning alone. spont, spontaneous discharge rate.

References

    1. Dan Y, Atick JJ, Reid RC. J. Neurosci. 1996;16:3351. - PMC - PubMed
    1. Olshausen BA, Field DJ. Nature. 1996;381:607. - PubMed
    1. Schwartz O, Simoncelli EP. Nature Neurosci. 2001;4:819. - PubMed
    1. Lewicki MS. Nature Neurosci. 2002;5:356. - PubMed
    1. Young ED. In: The Synaptic Organization of the Brain. Shepherd GM, editor. Oxford Univ. Press; New York: 1998. pp. 121–157.

Publication types