

Inhibition of adipogenesis and development of glucose intolerance by soluble preadipocyte factor-1 (Pref-1)
- PMID: 12588883
- PMCID: PMC151920
- DOI: 10.1172/JCI15924
Inhibition of adipogenesis and development of glucose intolerance by soluble preadipocyte factor-1 (Pref-1)
Abstract
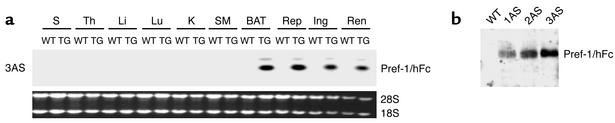
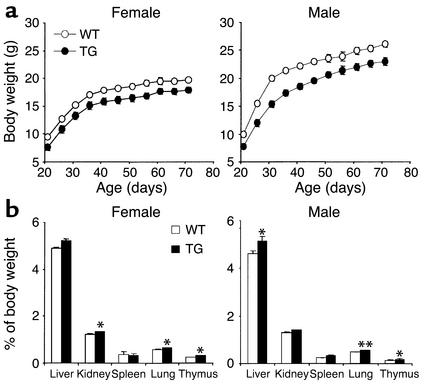
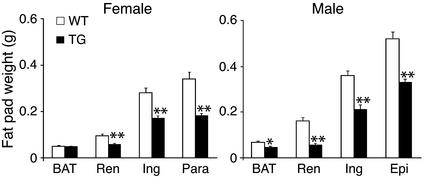
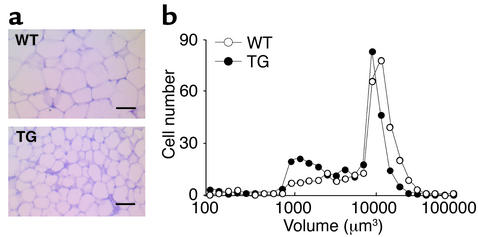
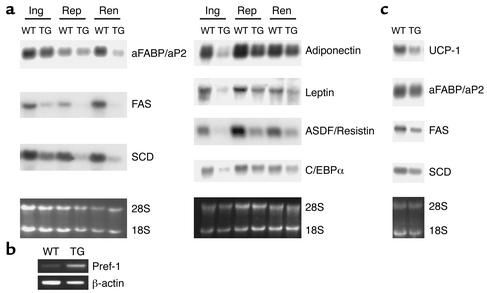
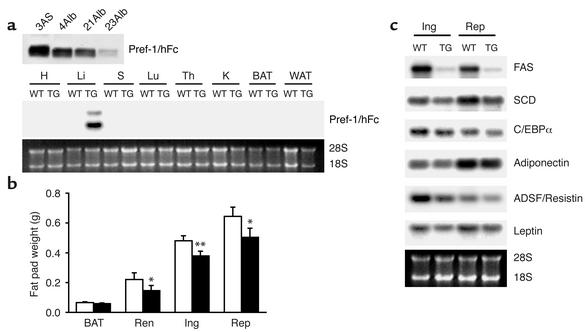
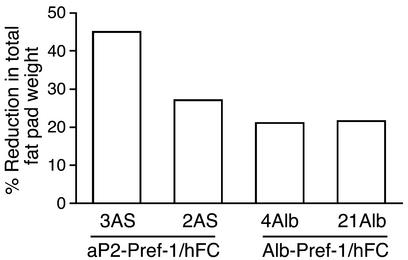
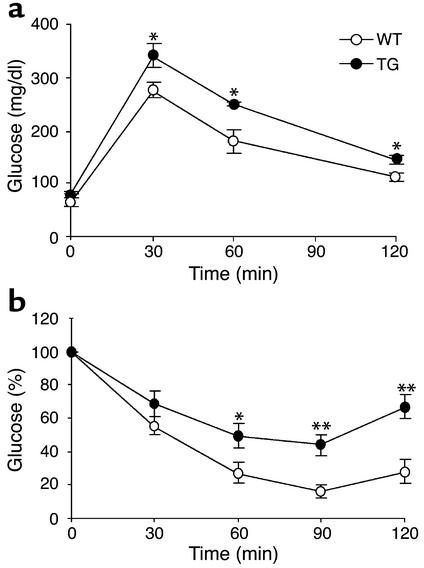
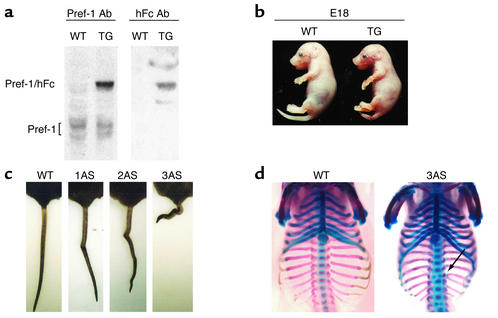
Preadipocyte factor-1 (Pref-1) is a transmembrane protein highly expressed in preadipocytes. Pref-1 expression is, however, completely abolished in adipocytes. The extracellular domain of Pref-1 undergoes two proteolytic cleavage events that generate 50 and 25 kDa soluble products. To understand the function of Pref-1, we generated transgenic mice that express the full ectodomain corresponding to the large cleavage product of Pref-1 fused to human immunoglobulin-gamma constant region. Mice expressing the Pref-1/hFc transgene in adipose tissue, driven by the adipocyte fatty acid-binding protein (aP2, also known as aFABP) promoter, showed a substantial decrease in total fat pad weight. Moreover, adipose tissue from transgenic mice showed reduced expression of adipocyte markers and adipocyte-secreted factors, including leptin and adiponectin, whereas the preadipocyte marker Pref-1 was increased. Pref-1 transgenic mice with a substantial, but not complete, loss of adipose tissue exhibited hypertriglyceridemia, impaired glucose tolerance, and decreased insulin sensitivity. Mice expressing the Pref-1/hFc transgene exclusively in liver under the control of the albumin promoter also showed a decrease in adipose mass and adipocyte marker expression, suggesting an endocrine mode of action of Pref-1. These findings demonstrate the inhibition of adipogenesis by Pref-1 in vivo and the resulting impairment of adipocyte function that leads to the development of metabolic abnormalities.
Figures
Similar articles
-
Ectodomain shedding of preadipocyte factor 1 (Pref-1) by tumor necrosis factor alpha converting enzyme (TACE) and inhibition of adipocyte differentiation.Mol Cell Biol. 2006 Jul;26(14):5421-35. doi: 10.1128/MCB.02437-05. Mol Cell Biol. 2006. PMID: 16809777 Free PMC article.
-
Cleavage of membrane-associated pref-1 generates a soluble inhibitor of adipocyte differentiation.Mol Cell Biol. 1997 Feb;17(2):977-88. doi: 10.1128/MCB.17.2.977. Mol Cell Biol. 1997. PMID: 9001251 Free PMC article.
-
Transcriptional control of the pref-1 gene in 3T3-L1 adipocyte differentiation. Sequence requirement for differentiation-dependent suppression.J Biol Chem. 1998 Nov 27;273(48):31751-8. doi: 10.1074/jbc.273.48.31751. J Biol Chem. 1998. PMID: 9822638
-
Pref-1 and ADSF/resistin: two secreted factors inhibiting adipose tissue development.Horm Metab Res. 2002 Nov-Dec;34(11-12):664-70. doi: 10.1055/s-2002-38244. Horm Metab Res. 2002. PMID: 12660879 Review.
-
Function of pref-1 as an inhibitor of adipocyte differentiation.Int J Obes Relat Metab Disord. 2000 Nov;24 Suppl 4:S15-9. doi: 10.1038/sj.ijo.0801494. Int J Obes Relat Metab Disord. 2000. PMID: 11126233 Review.
Cited by
-
Delta-like 1 (DLK1) is a possible mediator of vitamin D effects on bone and energy metabolism.Bone. 2020 Sep;138:115510. doi: 10.1016/j.bone.2020.115510. Epub 2020 Jul 1. Bone. 2020. PMID: 32622071 Free PMC article. Clinical Trial.
-
Serum levels of fetal antigen 1 in extreme nutritional States.ISRN Endocrinol. 2012;2012:592648. doi: 10.5402/2012/592648. Epub 2012 Jul 15. ISRN Endocrinol. 2012. PMID: 22844611 Free PMC article.
-
Is retinol binding protein 4 a link between adiposity and cancer?Horm Mol Biol Clin Investig. 2015 Aug;23(2):39-46. doi: 10.1515/hmbci-2015-0019. Horm Mol Biol Clin Investig. 2015. PMID: 26136304 Free PMC article. Review.
-
Lack of miR-379/miR-544 Cluster Resists High-Fat Diet-Induced Obesity and Prevents Hepatic Triglyceride Accumulation in Mice.Front Cell Dev Biol. 2021 Aug 30;9:720900. doi: 10.3389/fcell.2021.720900. eCollection 2021. Front Cell Dev Biol. 2021. PMID: 34527673 Free PMC article.
-
Hypoxic tumor microenvironment and cancer cell differentiation.Curr Mol Med. 2009 May;9(4):425-34. doi: 10.2174/156652409788167113. Curr Mol Med. 2009. PMID: 19519400 Free PMC article. Review.
References
-
- Faust IM, Johnson PR, Stern JS, Hirsch J. Diet-induced adipocyte number increase in adult rats: a new model of obesity. Am. J. Physiol. 1978;235:E279–E286. - PubMed
-
- Klyde BJ, Hirsch J. Increased cellular proliferation in adipose tissue of adult rats fed a high-fat diet. J. Lipid. Res. 1979;20:705–715. - PubMed
-
- Klyde BJ, Hirsch J. Isotopic labeling of DNA in rat adipose tissue: evidence for proliferating cells associated with mature adipocytes. J. Lipid. Res. 1979;20:691–704. - PubMed
-
- Darlington GJ, Ross SE, MacDougald OA. The role of C/EBP genes in adipocyte differentiation. J. Biol. Chem. 1998;273:30057–30060. - PubMed
-
- MacDougald OA, Mandrup S. Adipogenesis: forces that tip the scales. Trends Endocrinol. Metab. 2002;13:5–11. - PubMed
Publication types
MeSH terms
Substances
Grants and funding
LinkOut - more resources
Full Text Sources
Other Literature Sources
Molecular Biology Databases
Research Materials
