

Identification of Hodgkin and Reed-Sternberg cell-specific genes by gene expression profiling
- PMID: 12588891
- PMCID: PMC151925
- DOI: 10.1172/JCI16624
Identification of Hodgkin and Reed-Sternberg cell-specific genes by gene expression profiling
Abstract
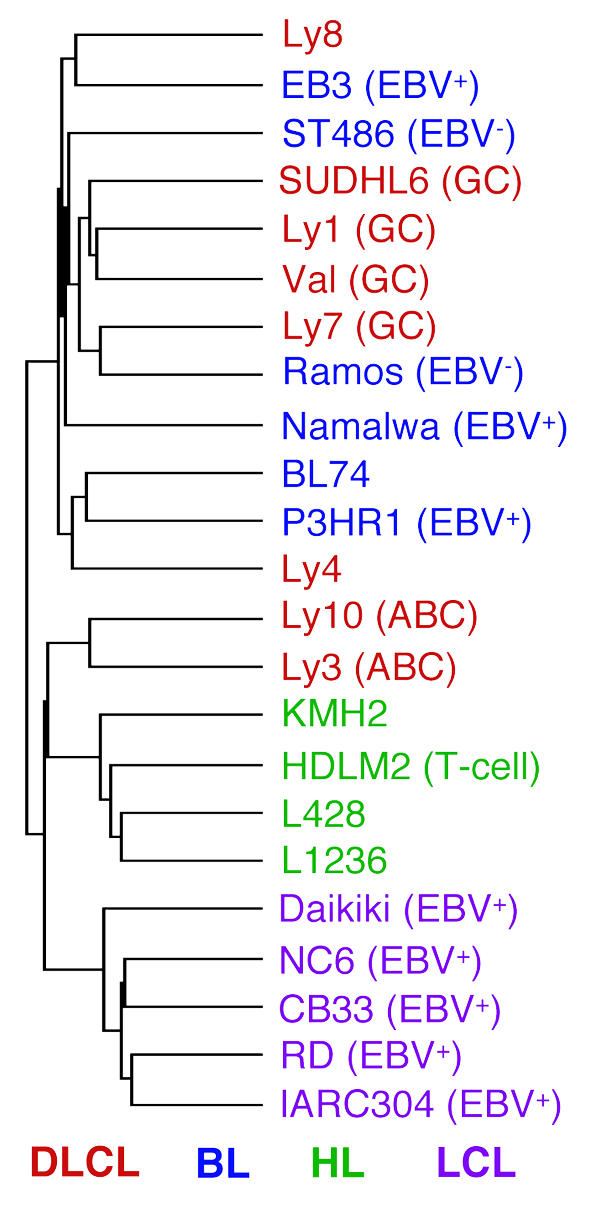
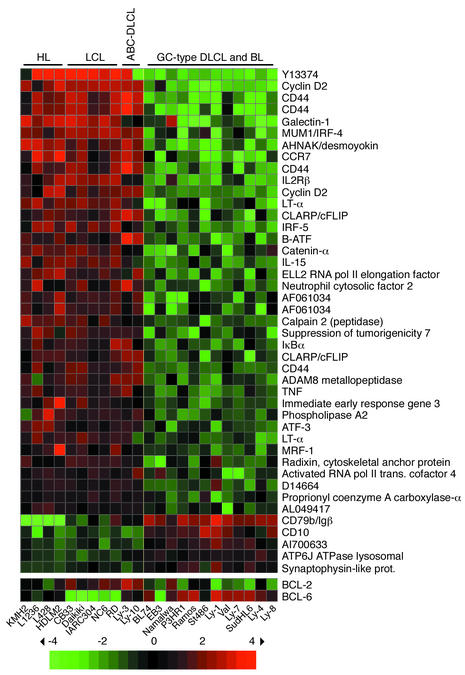
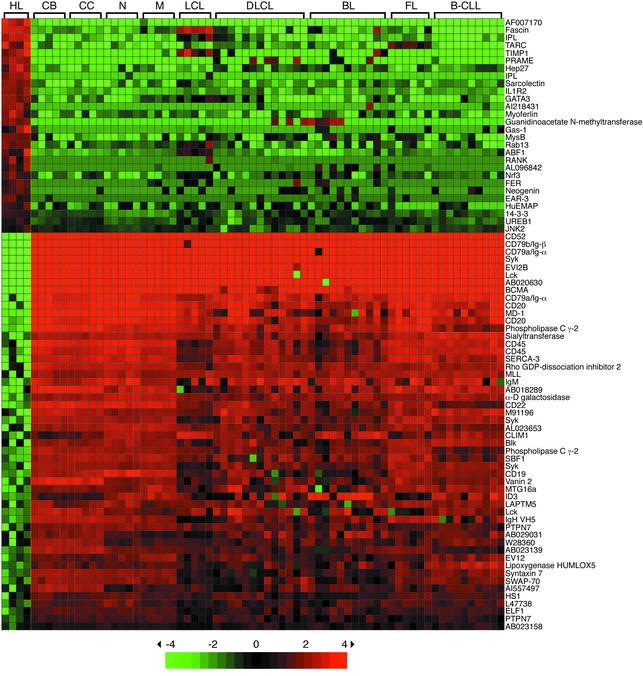
Hodgkin lymphoma (HL) is a malignancy of unknown pathogenesis. The malignant Hodgkin and Reed/Sternberg (HRS) cells derive from germinal center B cells (or rarely, T cells) but have a heterogeneous and largely uncharacterized phenotype. Using microarrays, we compared the gene expression profile of four HL cell lines with profiles of the main B cell subsets and B cell non-HLs to find out whether HRS cells, despite their described heterogeneity, show a distinct gene expression, to study their relationship to other normal and malignant B cells, and to identify genes aberrantly or overexpressed by HRS cells. The HL lines indeed clustered as a distinct entity, irrespective of their B or T cell derivation, and their gene expression was most similar to that of EBV-transformed B cells and cell lines derived from diffuse large cell lymphomas showing features of in vitro-activated B cells. Twenty-seven genes, most of which were previously unknown to be expressed by HRS cells, showed aberrant expression specifically in these cells, e.g., the transcription factors GATA-3, ABF1, EAR3, and Nrf3. For five genes, expression in primary HRS cells was confirmed. The newly identified HL-specific genes may play important roles in the pathogenesis of HL, potentially represent novel diagnostic markers, and can be considered for therapeutic targeting.
Figures
Similar articles
-
Hodgkin and Reed-Sternberg-like cells in B-cell chronic lymphocytic leukemia represent the outgrowth of single germinal-center B-cell-derived clones: potential precursors of Hodgkin and Reed-Sternberg cells in Hodgkin's disease.Blood. 2000 Feb 1;95(3):1023-31. Blood. 2000. PMID: 10648418
-
Loss of the B-lineage-specific gene expression program in Hodgkin and Reed-Sternberg cells of Hodgkin lymphoma.Blood. 2003 Feb 15;101(4):1505-12. doi: 10.1182/blood-2002-03-0839. Epub 2002 Sep 26. Blood. 2003. PMID: 12393731
-
Profiling of Hodgkin's lymphoma cell line L1236 and germinal center B cells: identification of Hodgkin's lymphoma-specific genes.Mol Med. 2003 Mar-Apr;9(3-4):85-95. Mol Med. 2003. PMID: 12865944 Free PMC article.
-
Molecular biology of Hodgkin's and Reed/Sternberg cells in Hodgkin's lymphoma.Int J Cancer. 2006 Apr 15;118(8):1853-61. doi: 10.1002/ijc.21716. Int J Cancer. 2006. PMID: 16385563 Review.
-
The Hodgkin and Reed/Sternberg cell.Int J Biochem Cell Biol. 2005 Mar;37(3):511-7. doi: 10.1016/j.biocel.2003.10.025. Int J Biochem Cell Biol. 2005. PMID: 15618006 Review.
Cited by
-
The Tumor Suppressive mir-148a Is Epigenetically Inactivated in Classical Hodgkin Lymphoma.Cells. 2020 Oct 14;9(10):2292. doi: 10.3390/cells9102292. Cells. 2020. PMID: 33066457 Free PMC article.
-
Expression of CCL28 by Reed-Sternberg cells defines a major subtype of classical Hodgkin's disease with frequent infiltration of eosinophils and/or plasma cells.Am J Pathol. 2004 Mar;164(3):997-1006. doi: 10.1016/S0002-9440(10)63187-2. Am J Pathol. 2004. PMID: 14982853 Free PMC article.
-
The Emerging Role of CAR T Cell Therapy in Relapsed/Refractory Hodgkin Lymphoma.J Pers Med. 2022 Feb 1;12(2):197. doi: 10.3390/jpm12020197. J Pers Med. 2022. PMID: 35207685 Free PMC article. Review.
-
MicroRNA signature in classical Hodgkin lymphoma.J Appl Genet. 2021 May;62(2):281-288. doi: 10.1007/s13353-021-00614-7. Epub 2021 Feb 5. J Appl Genet. 2021. PMID: 33544339 Free PMC article. Review.
-
PAX5 overexpression is not enough to reestablish the mature B-cell phenotype in classical Hodgkin lymphoma.Leukemia. 2014 Jan;28(1):213-6. doi: 10.1038/leu.2013.211. Epub 2013 Jul 11. Leukemia. 2014. PMID: 23842424 No abstract available.
References
-
- Weiss, L.M., Chan, J.K.C., MacLennan, K., and Warnke, R.A. 1999. Pathology of classical Hodgkin’s disease. In Hodgkin’s disease. P.M. Mauch, J.O. Armitage, V. Diehl, R.T. Hoppe, L.M. Weiss, editors. Lippencott Williams & Wilkins. Philadelphia, Pennsylvania, USA. 101–120.
-
- Küppers R. Molecular biology of Hodgkin’s lymphoma. Adv. Cancer Res. 2002;44:277–312. - PubMed
-
- Seitz V, et al. Detection of clonal T-cell receptor gamma-chain gene rearrangements in Reed-Sternberg cells of classic Hodgkin disease. Blood. 2000;95:3020–3024. - PubMed
Publication types
MeSH terms
Substances
LinkOut - more resources
Full Text Sources
Other Literature Sources
Medical
