. 2003 Feb;111(4):539-52.
doi: 10.1172/JCI16153.

Histone deacetylase inhibitors modulate renal disease in the MRL-lpr/lpr mouse

Affiliations

Histone deacetylase inhibitors modulate renal disease in the MRL-lpr/lpr mouse

Nilamadhab Mishra et al. J Clin Invest. 2003 Feb.

Abstract

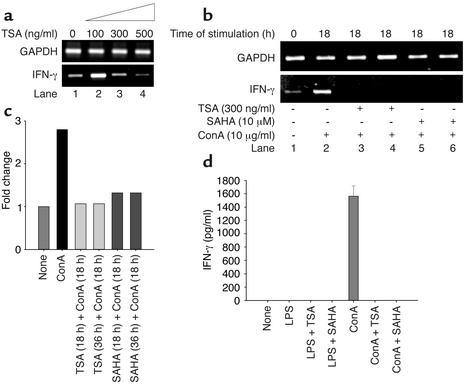
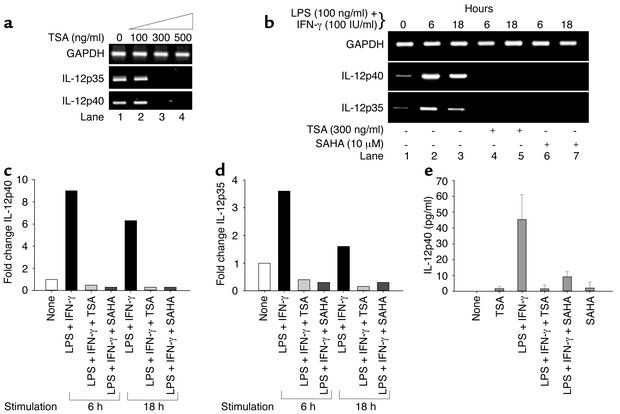
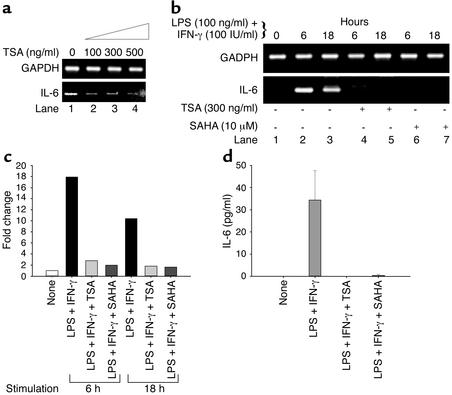
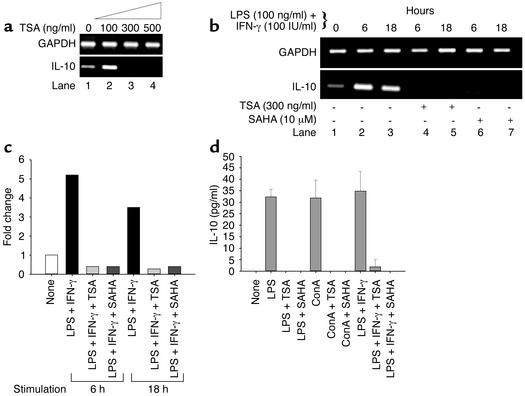
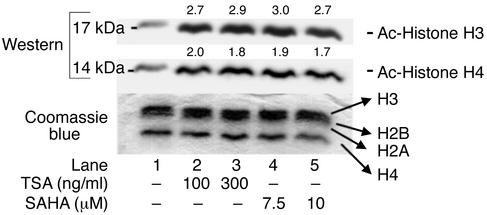
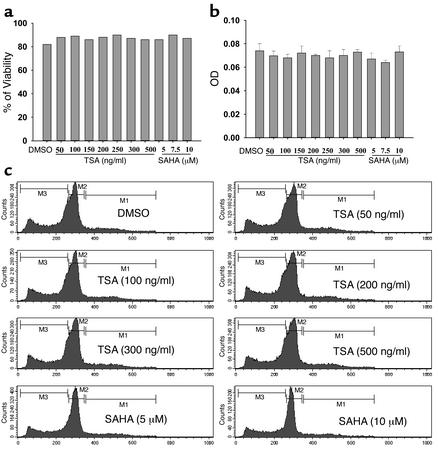
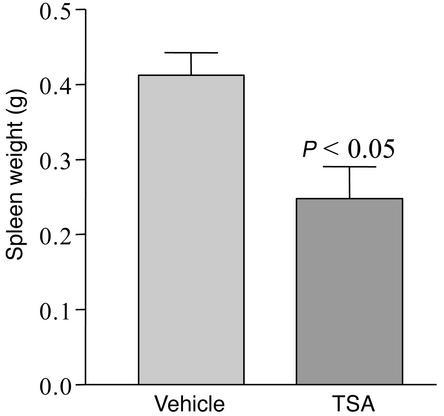
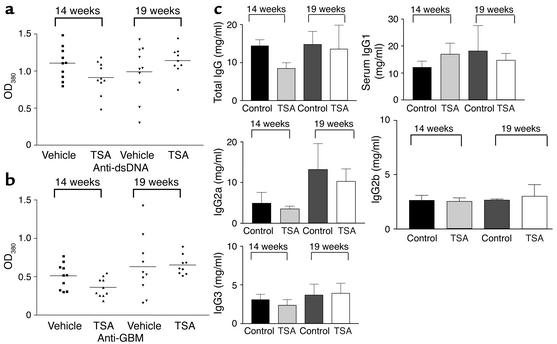
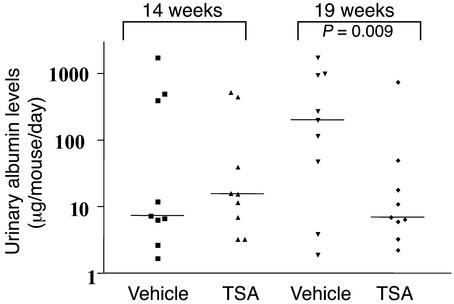
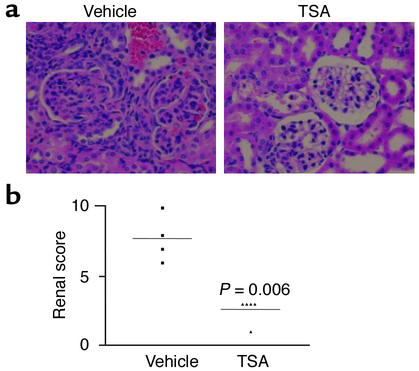
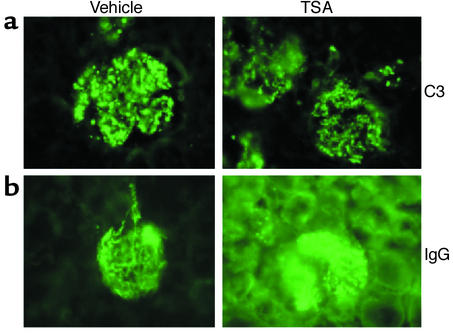
Studies in human systemic lupus erythematosus (SLE) suggest a possible role for histone deacetylases (HDACs) in skewed gene expression and disease pathogenesis. We used the MRL-lpr/lpr murine model of lupus to demonstrate that HDACs play a key role in the heightened levels of both Th1 and Th2 cytokine expression that contribute to disease. The availability of specific HDAC inhibitors (HDIs) such as trichostatin A (TSA) and suberonylanilide hydroxamic acid (SAHA) permits the study of the role of HDACs in gene regulation. Our results indicate that HDIs downregulate IL-12, IFN-gamma, IL-6, and IL-10 mRNA and protein levels in MRL-lpr/lpr splenocytes. This effect on gene transcription is associated with an increased accumulation of acetylated histones H3 and H4 in total cellular chromatin. To elucidate the in vivo effects of TSA on lupuslike disease, we treated MRL-lpr/lpr mice with TSA (0.5 mg/kg/d) for 5 weeks. Compared with vehicle-treated control mice, TSA-treated mice exhibited a significant reduction in proteinuria, glomerulonephritis, and spleen weight. Taken together, these findings suggest that increased expression of HDACs leading to an altered state of histone acetylation may be of pathologic significance in MRL-lpr/lpr mice. In addition, TSA or other HDIs may have therapeutic benefit in the treatment of SLE.


Figures

Figure 1
Figure 1
Downregulation of IFN-γ transcript and protein levels by TSA and SAHA. (a) TSA (300–500 ng/ml) decreases the level of IFN-γ mRNA relative to GAPDH mRNA in splenocytes from 24-week-old MRL-lpr/lpr mice. (b) Splenocytes from 10-week-old MRL-lpr/lpr mice were incubated in the absence or presence of 300 ng/ml TSA or 10 μM SAHA for 18 hours. Splenocytes were then stimulated with ConA (10 μg/ml) for 18 hours. In lanes 3 and 5, TSA or SAHA was added at the same time as ConA and cultured for 18 hours. IFN-γ mRNA levels relative to GAPDH are shown. (c) Based on densitometric scanning of the gel in b, this graph depicts the fold change of IFN-γ mRNA in cells cultured as described above. A representative of three independent experiments is shown. (d) Splenocytes from 10-week-old mice were cultured in the presence of vehicle, LPS, LPS plus TSA, LPS plus SAHA, ConA, ConA plus TSA, or ConA plus SAHA for 72 hours. The concentrations of TSA and SAHA were 300 ng/ml and 10 μM, respectively. This graph depicts the amount of IFN-γ protein secretion. The bar represents the mean ± SEM of three independent experiments.
Figure 2
Figure 2
Downregulation of IL-12 transcript and protein levels by TSA and SAHA. (a) Increasing concentrations of TSA (0–500 ng/ml) progressively decrease levels of IL-12p40 and IL-12p35 mRNA relative to GAPDH mRNA in splenocytes from 24-week-old MRL-lpr/lpr mice. (b) Splenocytes from 10-week-old MRL-lpr/lpr mice were incubated in the absence or presence of 300 ng/ml TSA or 10 μM SAHA for 18 hours. Splenocytes were then stimulated with LPS (100 ng/ml) plus IFN-γ (100 IU/ml) for 6 or 18 hours. IL-12p40 and IL-12p35 mRNA levels relative to GAPDH are shown. (c and d) Based on densitometric scanning of the gel in b, these graphs depict the fold change of IL-12p40 (c) and IL-12p35 (d) mRNA in cells cultured as described above. A representative of three independent experiments is shown. (e) Splenocytes from 10-week-old mice were cultured in the presence of vehicle, TSA, LPS plus IFN-γ, LPS plus IFN-γ plus TSA, LPS plus IFN-γ plus SAHA, or SAHA for 24 hours. The concentrations of TSA and SAHA were 300 ng/ml and 10 μM, respectively. This graph depicts the amount of IL-12p40 protein secretion. The bar represents the mean ± SEM of three independent experiments.
Figure 3
Figure 3
Downregulation of IL-6 transcript and protein levels by TSA and SAHA. (a) Increasing concentrations of TSA (0–500 ng/ml) progressively decrease levels of IL-6 relative to GAPDH mRNA in splenocytes from 24-week-old MRL-lpr/lpr mice. (b) Splenocytes from 10-week-old MRL-lpr/lpr mice were incubated in the absence or presence of 300 ng/ml TSA or 10 μM SAHA for 18 hours. Splenocytes were then stimulated with LPS (100 ng/ml) plus IFN-γ (100 IU/ml) for 6 or 18 hours. IL-6 mRNA levels relative to GAPDH are shown. (c) Based on densitometric scanning of the gel in b, this graph depicts the fold change of IL-6 mRNA in cells cultured as described above. A representative of three independent experiments is shown. (d) Splenocytes from 10-week-old mice were cultured in the presence of vehicle, LPS plus IFN-γ, LPS plus IFN-γ plus TSA, or LPS plus IFN-γ plus SAHA for 72 hours. The concentrations of TSA and SAHA were 300 ng/ml and 10 μM, respectively. This graph depicts the amount of IL-6 protein secretion. The bar represents the mean ± SEM of three independent experiments.
Figure 4
Figure 4
Downregulation of IL-10 transcript and protein levels by TSA and SAHA. (a) TSA (300–500 ng/ml) decreases the levels of IL-10 mRNA relative to GAPDH mRNA in splenocytes from 24-week-old MRL-lpr/lpr mice. (b) Splenocytes from 10-week-old MRL-lpr/lpr mice were incubated in the absence or presence of 300 ng/ml TSA or 10 μM SAHA for 18 hours. Splenocytes were then stimulated with LPS (100 ng/ml) plus IFN-γ (100 IU/ml) for 6 or 18 hours. IL-10 mRNA levels relative to GAPDH are shown. (c) Based on densitometric scanning of the gel in b, this graph depicts the fold change of IL-10 mRNA in cells cultured as described above. A representative of three independent experiments is shown. (d) Splenocytes from 10-week-old mice were cultured for 72 hours in the presence of vehicle, LPS, LPS plus TSA, LPS plus SAHA, ConA, ConA plus TSA, ConA plus SAHA, LPS plus IFN-γ, LPS plus IFN-γ plus TSA, or LPS plus IFN-γ plus SAHA. The concentrations of TSA and SAHA were 300 ng/ml and 10 μM, respectively. This graph depicts the amount of IL-10 protein secretion. The bar represents the mean ± SEM of three independent experiments.
Figure 5
Figure 5
Western immunoblot analysis of acetylated histones H3 and H4 in 24-week-old MRL-lpr/lpr splenocytes. Histones were isolated by acid extraction from cells cultured with different doses of TSA or SAHA for 18 hours. Acetylation was detected using anti–acetylated H3 and H4 Ab’s. A parallel gel stained with Coomassie blue is shown as a control for protein loading in each lane (–68).
Figure 6
Figure 6
Effects of different concentrations of TSA or SAHA on cell viability. Cell viability was assessed by trypan blue exclusion (a), MTT method (b), and cell cycle analysis by propidium iodide staining (c). The bars represent the mean ± SD of triplicates.
Figure 7
Figure 7
Spleen weights of MRL-lpr/lpr mice receiving daily injections of either TSA (0.5 mg/kg BW in DMSO) or vehicle (DMSO) for 5 weeks beginning at 14 weeks of age (n = 5, P < 0.05).
Figure 8
Figure 8
Serum anti-dsDNA and anti-GBM Ab levels in MRL-lpr/lpr mice receiving daily injections of either TSA (0.5 mg/kg BW in DMSO) or vehicle (DMSO) measured by ELISA at 14 and 19 weeks of age. (a) Anti-dsDNA levels in sera from MRL-lpr/lpr mice. Data are the OD380 at 1:100 serum dilution in each group with 5 μg/ml double-stranded calf thymus DNA as antigen. (b) Anti-GBM Ab levels in sera from MRL-lpr/lpr mice. Data are the OD380 at 1:100 sera dilution in each group with 50 μg/ml rat GBM as antigen. (c) Total IgG and IgG isotype levels in sera from MRL-lpr/lpr mice.
Figure 9
Figure 9
Urinary-albumin excretion by MRL-lpr/lpr mice receiving daily injections of either TSA (0.5 mg/kg BW in DMSO) or vehicle (DMSO) for 5 weeks beginning at 14 weeks of age. Data are the 24-hour urinary albumin excretion (μg/mouse/day) in each group. At 19 weeks of age, four of the nine untreated mice had albumin excretion above 1 mg/d, while none of the nine TSA-treated mice had albuminuria above 1 mg/d (P < 0.05 at 19 weeks).
Figure 10
Figure 10
(a) Representative kidney sections stained with H&E from an MRL-lpr/lpr mouse receiving daily injections of either TSA (0.5 mg/kg BW in DMSO) or vehicle (DMSO) for 5 weeks beginning at 14 weeks of age. At the time of sacrifice (19 weeks), the kidneys were removed and then sectioned before staining with H&E. (b) The kidney slides were graded for glomerular inflammation, proliferation, crescent formation, and necrosis. Scores from 0 to 3+ were assigned for each of these features and then added together to yield a final renal score.
Figure 11
Figure 11
Immunohistochemical analysis of IgG and C3 deposition in the kidneys of MRL-lpr/lpr mice receiving daily injections of either TSA (0.5 mg/kg BW in DMSO) or vehicle (DMSO) for 5 weeks beginning at 14 weeks of age. (a) Representative section of a kidney stained for IgG fluorescence. (b) Representative section of a kidney stained for C3 fluorescence.

Similar articles

Cited by

References

    1. Gladman, D.D., and Urowitz, M.B. 1997. Prognostic subsets and mortality in systemic lupus erythematosus. In Dubois’ lupus erythematosus. D.J. Wallace and B.H. Hahn, editors. Williams & Wilkins. Baltimore, Maryland, USA. 1213–1229.
    1. Theofilopoulos AN, Dixon FJ. Murine models of systemic lupus erythematosus. Adv. Immunol. 1985;37:269–390. - PubMed
    1. Dean GS, Tyrrell-Price J, Crawley E, Isenberg DA. Cytokines and systemic lupus erythematosus. Ann. Rheum. Dis. 2000;59:243–251. - PMC - PubMed
    1. Murray LJ, Lee R, Martens C. In vivo cytokine gene expression in T cell subsets of the autoimmune MRL/Mp-lpr/lpr mouse. Eur. J. Immunol. 1990;20:163–170. - PubMed
    1. Handwerger, B.S., Luzina, I., da Silva, L., Storrer, C.E., and Via, C.S. 1999. Cytokines in the immunopathogenesis of lupus. In Lupus: molecular and cellular pathogenesis. G.M. Kammer and G.C. Tsokos, editors. Humana Press. Totowa, New Jersey, USA. 321–340.

Publication types

MeSH terms