Mechanisms of the cerebrovascular response to apnoea in humans
- PMID: 12588894
- PMCID: PMC2342799
- DOI: 10.1113/jphysiol.2002.029678
Mechanisms of the cerebrovascular response to apnoea in humans
Abstract
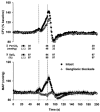
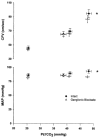
We measured ventilation, arterial O2 saturation, end-tidal CO2 (PET,CO2), blood pressure (intra-arterial catheter or photoelectric plethysmograph), and flow velocity in the middle cerebral artery (CFV) (pulsed Doppler ultrasound) in 17 healthy awake subjects while they performed 20 s breath holds under control conditions and during ganglionic blockade (intravenous trimethaphan, 4.4 +/- 1.1 mg min-1 (mean +/- S.D.)). Under control conditions, breath holding caused increases in PET,CO2 (7 +/- 1 mmHg) and in mean arterial pressure (MAP) (15 +/- 2 mmHg). A transient hyperventilation (PET,CO2 -7 +/- 1 mmHg vs. baseline) occurred post-apnoea. CFV increased during apnoeas (by 42 +/- 3 %) and decreased below baseline (by 20 +/- 2 %) during post-apnoea hyperventilation. In the post-apnoea recovery period, CFV returned to baseline in 45 +/- 4 s. The post-apnoea decrease in CFV did not occur when hyperventilation was prevented. During ganglionic blockade, which abolished the increase in MAP, apnoea-induced increases in CFV were partially attenuated (by 26 +/- 2 %). Increases in PET,CO2 and decreases in oxyhaemoglobin saturation (Sa,O2) (by 2 +/- 1 %) during breath holds were identical in the intact and blocked conditions. Ganglionic blockade had no effect on the slope of the CFV response to hypocapnia but it reduced the CFV response to hypercapnia (by 17 +/- 5 %). We attribute this effect to abolition of the hypercapnia-induced increase in MAP. Peak increases in CFV during 20 s Mueller manoeuvres (40 +/- 3 %) were the same as control breath holds, despite a 15 mmHg initial, transient decrease in MAP. Hyperoxia also had no effect on the apnoea-induced increase in CFV (40 +/- 4 %). We conclude that apnoea-induced fluctuations in CFV were caused primarily by increases and decreases in arterial partial pressure of CO2 (Pa,CO2) and that sympathetic nervous system activity was not required for either the initiation or the maintenance of the cerebrovascular response to hyper- and hypocapnia. Increased MAP or other unknown influences of autonomic activation on the cerebral circulation played a smaller but significant role in the apnoea-induced increase in CFV; however, negative intrathoracic pressure and the small amount of oxyhaemoglobin desaturation caused by 20 s apnoea did not affect CFV.
Figures


Similar articles
-
Baroreflex-induced sympathetic activation does not alter cerebrovascular CO2 responsiveness in humans.J Physiol. 2003 Sep 1;551(Pt 2):609-16. doi: 10.1113/jphysiol.2003.046987. Epub 2003 Jul 4. J Physiol. 2003. PMID: 12844511 Free PMC article. Clinical Trial.
-
Cerebrovascular reactivity to hypercapnia is unimpaired in breath-hold divers.J Physiol. 2007 Jul 15;582(Pt 2):723-30. doi: 10.1113/jphysiol.2007.128991. Epub 2007 Apr 5. J Physiol. 2007. PMID: 17412771 Free PMC article.
-
Interaction of carbon dioxide and sympathetic nervous system activity in the regulation of cerebral perfusion in humans.Hypertension. 2000 Sep;36(3):383-8. doi: 10.1161/01.hyp.36.3.383. Hypertension. 2000. PMID: 10988269
-
Physiology of static breath holding in elite apneists.Exp Physiol. 2018 May 1;103(5):635-651. doi: 10.1113/EP086269. Exp Physiol. 2018. PMID: 29512224 Review.
-
Hypercapnia and hypocapnia in neonates.World J Pediatr. 2008 Aug;4(3):192-6. doi: 10.1007/s12519-008-0035-5. World J Pediatr. 2008. PMID: 18822927 Review.
Cited by
-
The psychophysiology of blood-injection-injury phobia: looking beyond the diphasic response paradigm.Int J Psychophysiol. 2010 Oct;78(1):50-67. doi: 10.1016/j.ijpsycho.2010.05.007. Epub 2010 May 31. Int J Psychophysiol. 2010. PMID: 20576505 Free PMC article. Review.
-
Hypercapnia-induced vasodilation in the cerebral circulation is reduced in older adults with sleep-disordered breathing.J Appl Physiol (1985). 2022 Jan 1;132(1):14-23. doi: 10.1152/japplphysiol.00347.2021. Epub 2021 Oct 28. J Appl Physiol (1985). 2022. PMID: 34709067 Free PMC article.
-
Cerebrovascular response to arousal from NREM and REM sleep.Sleep. 2008 Mar;31(3):321-7. doi: 10.1093/sleep/31.3.321. Sleep. 2008. PMID: 18363307 Free PMC article.
-
The effect of hypercapnia on static cerebral autoregulation.Physiol Rep. 2014 Jun 27;2(6):e12059. doi: 10.14814/phy2.12059. Print 2014 Jun 1. Physiol Rep. 2014. PMID: 24973333 Free PMC article.
-
Pathophysiology of sleep apnea.Physiol Rev. 2010 Jan;90(1):47-112. doi: 10.1152/physrev.00043.2008. Physiol Rev. 2010. PMID: 20086074 Free PMC article. Review.
References
-
- Balfors EM, Franklin KA. Impairment of cerebral perfusion during obstructive sleep apnoeas. Am J Resp Crit Care Med. 1994;150:1587–1591. - PubMed
-
- Bishop CCR, Powell S, Rutt D, Browse NL. Transcranial Doppler measurement of middle cerebral artery blood flow velocity: a validation study. Stroke. 1986;17:913–915. - PubMed
-
- Busija DW, Heistad DD. Effects of cholinergic nerves on cerebral blood flow in cats. Circ Res. 1981;48:62–69. - PubMed
-
- Dempsey JA, Harms CA, Morgan BJ, Badr MS, Skatrud JB. Sleep effects on breathing and breathing stability. In: Crystal RG, West JB, editors. The Lung. Philadelphia, Pennsylvania: Blackwell Science Inc; 1997. pp. 2063–2072.
-
- Ekstrom-Jodal B, Haggendal E, Linder LE, Nilsson NJ. Cerebral blood flow autoregulation at high arterial pressures and different levels of carbon dioxide tension. Eur Neurol. 1972;6:6–10. - PubMed
Publication types
MeSH terms
Substances
LinkOut - more resources
Full Text Sources
Miscellaneous

