. 2003 Apr 15;548(Pt 2):383-400.
doi: 10.1113/jphysiol.2002.034801. Epub 2003 Feb 14.

Developmental changes in the expression of potassium currents of embryonic, neonatal and mature mouse inner hair cells

Affiliations

Developmental changes in the expression of potassium currents of embryonic, neonatal and mature mouse inner hair cells

Walter Marcotti et al. J Physiol. .

Erratum in

  • J Physiol. 2003 Aug 1;550(Pt 3):996

Abstract

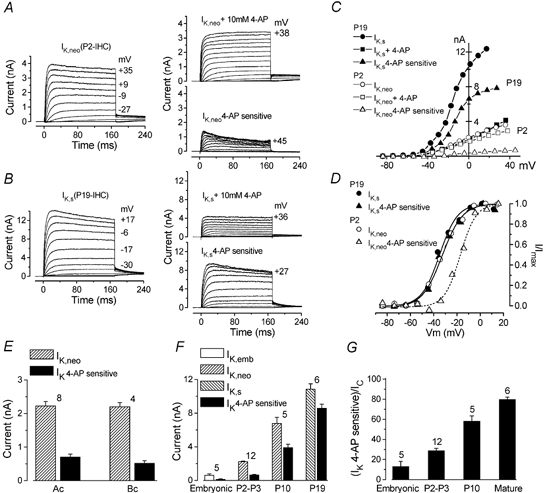
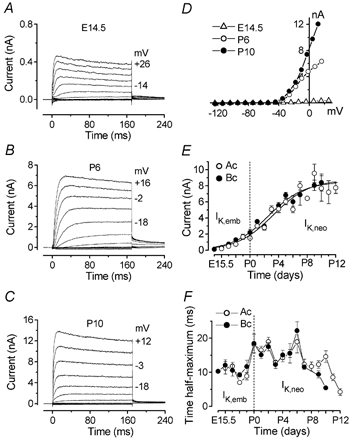
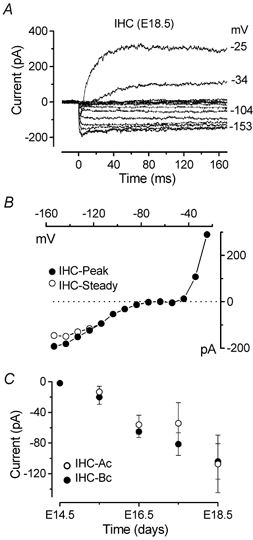
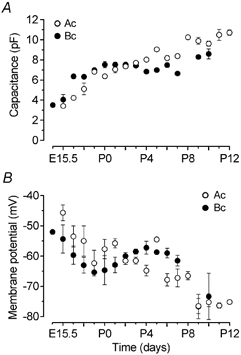
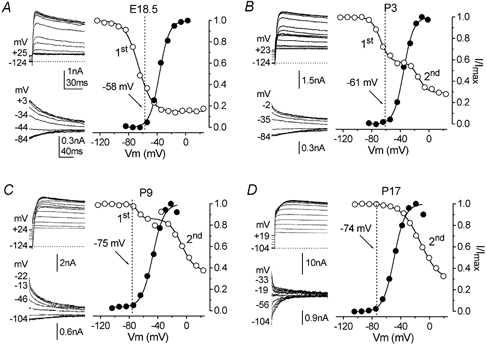
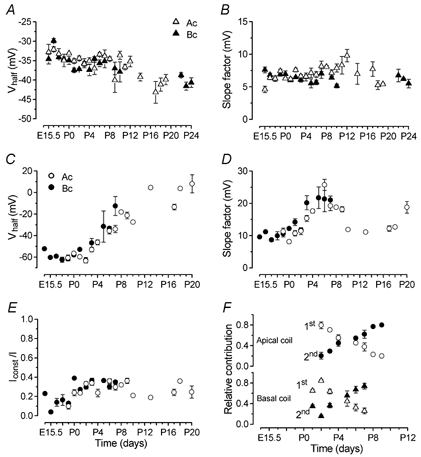
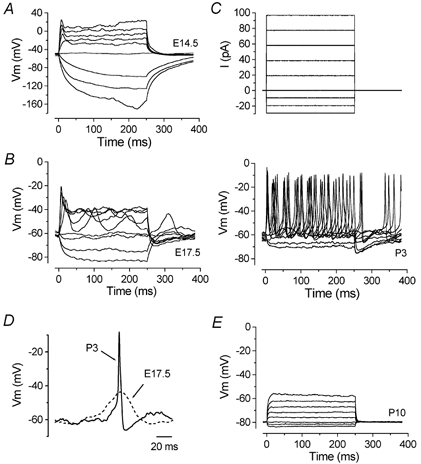
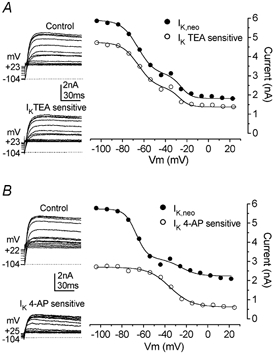
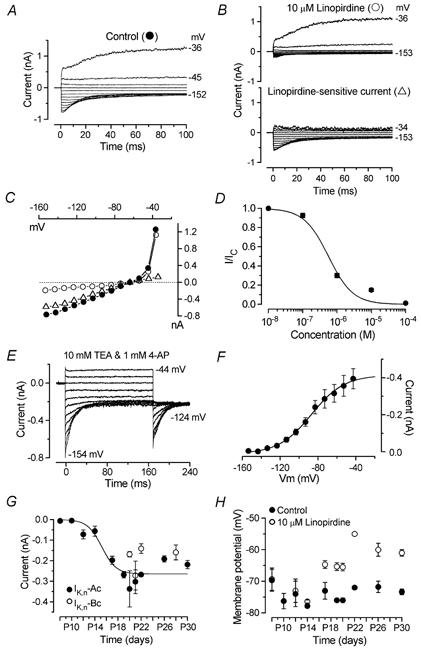
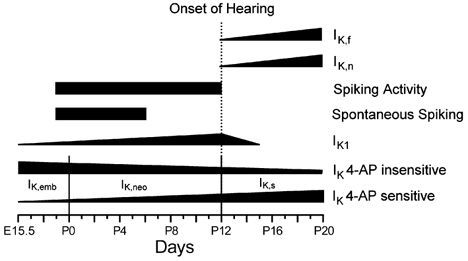
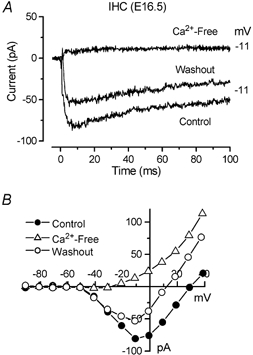
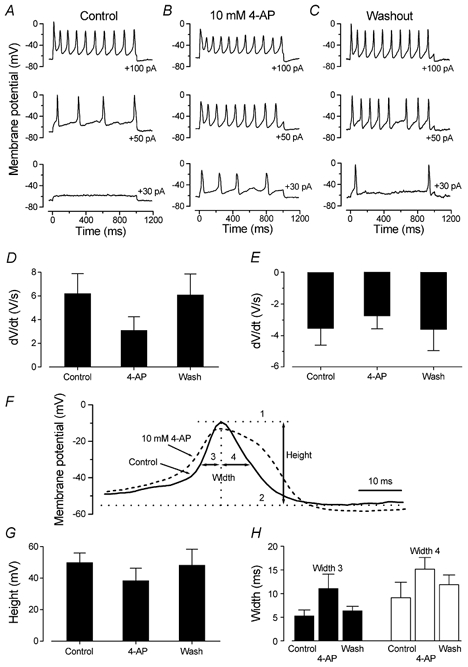
Developmental changes in electrophysiological membrane properties of mouse cochlear inner hair cells (IHCs) were studied from just after terminal differentiation up to functional maturity. As early as embryonic day 14.5 (E14.5) newly differentiated IHCs express a very small outward K+ current that is largely insensitive to 4-aminopyridine (4-AP). One day later the inward rectifier, IK1, is first observed. These immature cells initially exhibit only slow graded voltage responses under current clamp. From E17.5 spontaneous action potentials occur. During the first week of postnatal development, the outward K+ current steadily increases in size and a progressively larger fraction of the current is sensitive to 4-AP. During the second postnatal week, the activation of the 4-AP-sensitive current, by now contributing about half of the outward K+ current, shifts in the hyperpolarizing direction. Together with an increase in size of IK1, this hyperpolarizes the cell, thus inhibiting the spontaneous spike activity, although spikes could still be evoked upon depolarizing current injection. Starting at about the onset of hearing (postnatal day 12, P12) immature IHCs make the final steps towards fully functional sensory receptors with fast graded voltage responses. This is achieved mainly by the expression of the large-conductance Ca2+-activated K+ current IK,f, but also of a current indistinguishable from the negatively activating IK,n previously described in mature outer hair cells (OHCs). The 4-AP-sensitive current continues to increase after the onset of hearing to form the major part of the mature delayed rectifier, IK,s. By P20 IHCs appear mature in terms of their complement of K+ conductances.


Figures

Figure 5
Figure 5. Effect of 4-AP on the delayed rectifier K+ currents in IHCs during development
A and B, control current (IK,neo and IK,s), current in the presence of 10 mm 4-AP and 4-AP-sensitive current (obtained by trace-by-trace subtraction), recorded from one P2 and one P19 IHC from the apical coil of the cochlea. Membrane currents were elicited in response to depolarizing voltage steps (10 mV increments) from −84 mV to the various test potentials shown by some of the traces. C, steady-state I-V curves for the current traces shown in A and B. D, activation of IK,neo, IK,s and the current sensitive to 4-AP calculated from the tail currents at a constant potential of −44 mV for the cells shown in A and B. Lines are fits to eqn (2). Fitting parameters are as follows. P19: •, Imax 1848 pA, Vhalf−35.1 mV, S 7.7 mV; ▴, Imax 1484 pA, Vhalf−32.8 mV, S 8.1 mV. P2: ○, Imax> 505 pA, Vhalf−32.8 mV, S 8.7 mV; ▵, Imax 164 pA, Vhalf−17.3 mV, S 6.8 mV. P2 IHC: Vm−64 mV, Cm 7.1 pF, Rs 2.1 MΩ, gleak 1.6 nS. P19 IHC: Vm−73 mV, Cm 8.5 pF, Rs 2.4 MΩ, gleak 2.8 nS. E, size of the total and 4-AP-sensitive outward currents at 0 mV for IHCs positioned in the apical coil (Ac) and basal coil (Bc) of the P2 organ of Corti. F, development of the total delayed rectifier outward current and the 4-AP-sensitive current from embryonic to mature stages for apical coil IHCs. G, relative contribution of the 4-AP-sensitive current to the total delayed rectifier outward K+ current in apical IHCs during development. Ic, control current. Number of cells in E–G shown above each column or column pair.
Figure 1
Figure 1. Outward K+ currents in mouse cochlear inner hair cells (IHCs) during development
A–C, currents under voltage clamp from basal coil IHCs recorded at E14.5, P6 and P10. Currents were elicited by hyperpolarizing and depolarizing voltage steps (10 mV nominal increments) from −84 mV. Actual test potentials reached are shown by some of the traces. Note the different scales used for the ordinate at different ages to accommodate the large developmental increase in current size. In this and subsequent figures, all current recordings shown are single traces. D, steady-state current-voltage (I–V) curves of the currents shown in A–C. E14.5: resting membrane potential (Vm) −52 mV; cell capacitance (Cm) 3.8 pF; series resistance (Rs) 1.1 MΩ; leak conductance (gleak) 0.7 nS. P6: Vm−73 mV; Cm 7.6 pF; Rs 1.5 MΩ; gleak 2.0 nS. P10: Vm−65 mV; Cm 8.5 pF; Rs 1.1 MΩ; gleak 5.7 nS. E, development of the total, steady-state outward current measured at 0 mV from a holding potential of −84 mV (○, apical coil (Ac) hair cells; •, basal coil (Bc) hair cells). Fits to the data are according to eqn (1). Values for thalf and k are: Ac: P3.2, 0.40 day−1; number of cells measured at the various ages (E15.5–P12) 4, 4, 4, 3, 1, 4, 21, 19, 18, 2, 9, 5, 4, 2, 5, 3, 6. Bc: P2.6, 0.40 day−1; number of cells (E14.5–P10) 4, 5, 4, 6, 3, 3, 10, 19, 4, 11, 3, 5, 2, 3, 3. F, time to half-maximal activation of the outward K+ current measured at −20 mV as a function of age. Ac: number of cells (E15.5–P12) 4, 3, 1, 3, 1, 4, 20, 16, 20, 2, 8, 6, 4, 2, 3, 3, 6. Bc: number of cells (E14.5–P10) 1, 5, 4, 6, 3, 3, 11, 16, 7, 7, 3, 6, 2, 3, 3.
Figure 8
Figure 8. Embryonic onset of the inward rectifier K+ current
A, current responses from an E18.5 basal coil IHC, recorded using 10 mV voltage steps nominally between −24 and −154 mV starting from a holding potential of −64 mV. Membrane potentials are shown by some of the traces. The rapid activation of IK1 is evident by comparison with the outward K+ currents that activate slowly positive to −50 mV. B, I-V curves for the peak and steady-state current shown in A. Vm−64 mV; Cm 6.8 pF; Rs 1.6 MΩ; gleak 1.8 nS. C, embryonic development of IK1 was measured as steady-state currents at −153 mV. Number of cells measured at the various ages: ○, apical coil (E15.5–E18.5): 2, 2, 2, 3; •, basal coil (E14.5–E18.5): 5, 3, 3, 4, 3.
Figure 2
Figure 2. Development of membrane capacitance and resting membrane potential
A, growth of the membrane capacitance of IHCs with age. Ac: number of cells (E15.5–P12) 4, 4, 4, 3, 5, 7, 21, 31, 21, 2, 14, 11, 5, 5, 5, 3, 6. Bc: number of cells (E14.5–P10) 4, 5, 4, 6, 3, 3, 14, 19, 8, 11, 3, 9, 2, 3, 3. B, changes in membrane potential during development. Ac: number of cells (E15.5–P12) 3, 2, 2, 3, 3, 4, 21, 18, 15, 2, 6, 5, 4, 2, 4, 3, 6. Bc: number of cells (E14.5–P10) 1, 3, 3, 6, 3, 3, 10, 19, 4, 10, 3, 4, 2, 3, 3.
Figure 3
Figure 3. Activation and inactivation curves for the outward K+ currents during IHC maturation
Typical examples of normalized steady-state activation (•) and inactivation (○) curves for the total outward currents from apical coil IHCs (A, E18.5; B, P3; C, P9; and D, P17). Activation curves were obtained by plotting tail currents at −44 mV shown in the lower insets in each panel. Tail currents at nominally +36 mV (upper insets) were used to derive the inactivation curves. Some of the values of the conditioning potentials are shown next to the traces. The continuous lines are fits using eqn (2) for steady-state activation and eqns (3) or (4) for steady-state inactivation (see text for details). 1st indicates the inactivation of the K+ current component present early on in development and 2nd indicates the additional, more depolarized, component that develops from just after birth. The vertical dashed lines are the average resting membrane potentials for each developmental age. Fitting parameters are as folllows. E18.5: •, Imax 543 pA, Vhalf−36.8 mV, S 6.8 mV; ○, Imax 2801 pA, Vhalf−66.2 mV, S 9.5 mV (Cm 6.8 pF, Rs 1.4 MΩ, gleak 1.8 nS). P3: •, Imax 763 pA, Vhalf−35.3 mV, S 6.9 mV; ○, Imax 4426 pA, Vhalf1−67.9 mV, S1 6.4 mV, Vhalf2−14.5 mV, S2 6.3 mV (with curve 1 contributing 60 % and curve 2 contributing 40 %) (Cm 8.1 pF, Rs 1.8 MΩ, gleak 1.8 nS). P9: •, Imax 1467 pA, Vhalf−47.1 mV, S 7.8 mV; ○, Imax 5811 pA, Vhalf1−68.1 mV, S1 3.7 mV, Vhalf2−6.8 mV, S2 8.9 mV (with curve 1 contributing 24 % and curve 2 contributing 76 %) (Cm 10.5 pF, Rs 1.1 MΩ, gleak 1.0 nS). P17: •, Imax 3630 pA, Vhalf−49.3 mV, S 7.6 mV (Cm 10 pF, Rs 1.2 MΩ, gleak 1.0 nS). ○, Imax 22784 pA, Vhalf−12.8 mV, S 12.9 mV (Cm 9.3 pF, Rs 0.8 MΩ, gleak 4.0 nS).
Figure 4
Figure 4. Development of activation and inactivation parameters for the outward K+ currents
A and B, Vhalf and S for the activation curves measured at −44 mV of the total outward K+ current recorded in IHCs from E15.5–P24. Number of cells measured at the various ages, from left to right: ▵, apical coil (E15.5–P19) 4, 4, 4, 3, 1, 4, 20, 19, 18, 2, 9, 6, 4, 4, 10, 3, 7, 2, 3, 4, 8; ▴, basal coil (E15.5–P10 and P22–P24) 5, 4, 6, 3, 3, 10, 19, 4, 11, 3, 5, 2, 3, 3, 2, 3, 4. C and D, Vhalf and S of the steady-state inactivation measured at nominally +36 mV as a function of age. ○, apical coil (E18.5–P10 and P13, P17–P20) 3, 4, 3, 8, 10, 7, 10, 8, 1, 4, 1 and 1, 3, 1, 3. •, basal coil (E14.5–P7) 1, 1, 3, 2, 3, 1, 4, 6, 4, 2, 7, 4. E, size of the non-inactivating component (Iconst) plotted as a fraction of the maximum tail current at +36 mV. Number of cells as in C and D. F, maturation of the relative contribution of the two inactivating components plotted as a fraction of the total steady-state inactivation (open and filled symbols indicate the earlier 1st and the developing 2nd components of the outward K+ currents, respectively). Number of cells: apical IHCs (P2–P9) 6, 10, 7, 10, 8, 1, 4; basal IHCs (P1–P7) 4, 4, 4, 2, 7, 4.
Figure 10
Figure 10. IHC voltage responses during developmental maturation
AE, voltage responses under current clamp from basal coil IHCs just after terminal mitosis (E14.5), later in embryonic development (E17.5), early postnatally (P3) and just before the onset of hearing (P10). Current steps were applied from the resting potential in 10 pA increments between −30 and +100 pA and for clarity only responses to every other depolarizing current step are shown, as in the recorded current steps for the P3 cell (top panel in C). Note the larger range of potentials for the ordinate of A compared to B, C and E. Spontaneous action potentials occurred without current injection for the cells shown in B and C. D, comparison on an expanded time scale of spontaneous action potentials from the cells of B and C. E14.5: Vm−52 mV, Cm 3.8 pF, Rs 1.1 MΩ, gleak 0.7 nS. E17.5: Vm−64 mV, Cm 6.5 pF, Rs 2.6 MΩ, gleak 0.3 nS. P3: Vm−62 mV, Cm 6.9 pF, Rs 3.1 MΩ, gleak 2.1 nS. P10: Vm−76 mV, Cm 7.8 pF, Rs 5.1 MΩ, gleak 4.9 nS. The temperature in all cells investigated was between 35 and 37 °C.
Figure 6
Figure 6. Effects of TEA and 4-AP on inactivation of outward K+ currents
A, inactivation curves for the control (•) and TEA-sensitive (○) currents were obtained by plotting the peak currents measured at a test potential of +36 mV (insets) after a series of conditioning steps between −104 and +23 mV (4 s duration). The TEA-sensitive current (inset bottom panel) was obtained by subtracting the current remaining after superfusion of 30 mm TEA from the control current (inset top panel). Fitted curves are according to eqn (4). Fitting parameters are as follows. •, Vhalf1−65.6 mV, S1 7.6 mV, Vhalf2−25.7 mV, S2 4.9 mV (with curve 1 contributing 69 % and curve 2 contributing 31 % of the inactivating current); ○, Vhalf1−68.9 mV, S1 7.6 mV, Vhalf2−17.5 mV, S2 6.3 mV (with curve 1 contributing 71 % and curve 2 contributing 29 %). P3 apical IHC: Vm−63 mV, Cm 6.6 pF, Rs 2.0 MΩ, gleak 1.0 nS. B, membrane currents and steady-state inactivation curves for the control (inset top panel) and the 4-AP-sensitive current (inset bottom panel). Fits using eqn (4) for the control and eqn (3) for the 4-AP-sensitive current. Fitting parameters: •, Vhalf1−66.9 mV, S1 5.2 mV, Vhalf2−25.0 mV, S2 8.0 mV (with curve 1 contributing 74 % and curve 2 contributing 26 %); ○, Vhalf−35.3 mV, S 10.0 mV. P3 apical IHC: Vm−64 mV, Cm 7.5 pF, Rs 2.1 MΩ, gleak 1.2 nS.
Figure 7
Figure 7. Linopirdine-sensitive current in developing IHCs
Membrane currents recorded from an IHC (P20) before (A) and during (B, top panel) superfusion of 10 μm linopirdine from a holding potential of −64 mV. The linopirdine-sensitive current (B, bottom panel) was obtained by subtraction. Holding currents: +109 pA (A) and +23 pA (B) plotted as zero current. Resting membrane potential: −77 mV (A) and −67 mV (B). Cm 9.9 pF; Rs 2.1 MΩ, gleak 1.0 nS. C, peak I-V curves for the traces shown in A and B. D, concentration-response curve for block of IK,n by linopirdine. Current size was measured as the difference between instantaneous and steady-state deactivating tail currents for voltage steps from −64 to −124 mV. Logistic curve: I/Icontrol= 1/(1 + ([D]/KD)nH) fitted with KD = 0.56 ± 0.15 μm and nH (Hill coefficient) = 1.2 ± 0.3. [D] is the drug concentration. Number of cells, from left to right: 4, 3, 3, 10, 3. E, membrane currents elicited by voltage steps in 10 mV decrements from −44 to −154 mV starting from −64 mV in 10 mm TEA and 1 mm 4-AP (apical IHC, P21). Holding current +38 pA. Cm 11.2 pF; Rs 1.9 MΩ, gleak 0.7 nS. F, average steady-state activation curve from tail currents measured at −124 mV in four different IHCs (P21, including the cell shown in E). G, development of IK,n in IHCs. Fit to the apical coil data is according to a sigmoidal logistic growth curve (eqn (1)). Values for thalf and k are: P15.2, 0.8 day−1; Number of apical coil IHCs from left to right: 3, 4, 4, 4, 3, 3, 4, 4, 1, 3, 3; basal coil IHCs: 5, 4, 2, 4. H, effects of linopirdine on resting membrane potential during IHC development. Number of cells measured at the various ages (P8–P30): 3, 4, 4, 5, 3, 3, 4, 1, 4, 3. All panels, except G, show data from apical coil IHCs only.
Figure 12
Figure 12. Schematic representation of changes in K+ current expression during development in mouse IHCs
The diagram shows the timing of the appearance and disappearance of K+ currents and spike activity during maturation. The change in width of the horizontal bars gives an approximate indication of developmental changes in the size of the currents. The timing is valid for the apical coil (changes in basal coil IHCs were usually shifted forward by 1–2 days).
Figure 9
Figure 9. Ca2+ currents in an embryonic IHC
A, currents from an E16.5 basal coil IHC, in 1.3 mm extracellular Ca2+ (Control and Washout) and during superfusion of a nominally Ca2+-free solution, in response to voltage steps from −81 to −11 mV. B, peak I-V curves for the cell shown in A. Currents were elicited using 10 mV voltage steps nominally between −91 and +39 mV starting from a holding potential of −81 mV. Cm 4.8 pF, Rs 5.5 MΩ, gleak 0.3 nS.
Figure 11
Figure 11. Effects of 4-AP on action potential timing in IHCs
A–C, voltage responses from a P7 apical coil IHC before (Control), during and after (Washout) extracellular application of 10 mm 4-AP. Superfusion of 4-AP resulted in resting membrane potential depolarization from around −69 to −63 mV and broader action potentials in response to depolarizing current injection. Cm 8.2 pF, Rs 2.5 MΩ, temperature 36 °C. D and E, rate of rise and fall, respectively, of the action potentials in P7 apical coil IHCs before, during and after extracellular application of 10 mm 4-AP (n = 5). F, single action potential from a P7 IHC before (continuous line) and during (dashed line) superfusion of 4-AP. For the control spike we show how the height (level 1 minus level 2) and width (at half its maximum height) of the action potential were calculated. Separate measurements were made for widths 3 and 4. G and H, height and width of the action potentials, respectively, before, during and after application of 4-AP (n = 5).

Similar articles

Cited by

References

    1. Anniko M. Cytodifferentiation of cochlear hair cells. Am J Otolaryngol. 1983;4:375–388. - PubMed
    1. Beisel KW, Nelson NC, Delimont DC, Fritzsch B. Longitudinal gradients of KCNQ4 expression in spiral ganglion and cochlear hair cells correlate with progressive hearing loss in DFNA2. Mol Brain Res. 2000;82:137–149. - PubMed
    1. Beutner D, Moser T. The presynaptic function of mouse cochlear inner hair cells during development of hearing. J Neurosci. 2001;21:4593–4599. - PMC - PubMed
    1. Echteler SM. Developmental segregation in the afferent projections to mammalian auditory hair cells. Proc Natl Acad Sci U S A. 1992;89:6324–6327. - PMC - PubMed
    1. Ehret G. Masked auditory thresholds, critical ratios, and scales of the basilar membrane of the housemouse (Mus musculus) J Comp Physiol. 1975;103:329–341.

Publication types

MeSH terms

LinkOut - more resources