

Dietary restriction normalizes glucose metabolism and BDNF levels, slows disease progression, and increases survival in huntingtin mutant mice
- PMID: 12589027
- PMCID: PMC151440
- DOI: 10.1073/pnas.0536856100
Dietary restriction normalizes glucose metabolism and BDNF levels, slows disease progression, and increases survival in huntingtin mutant mice
Abstract
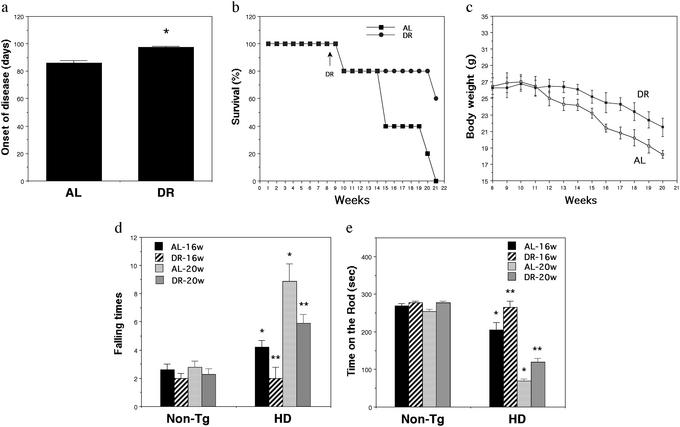
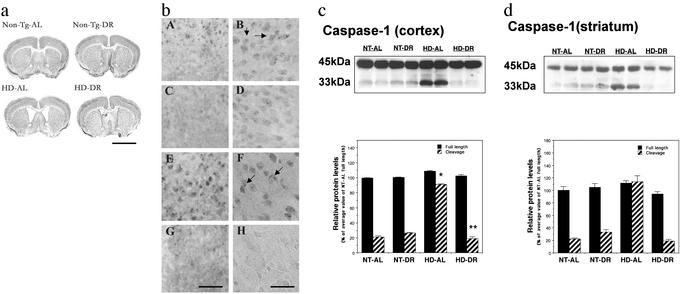
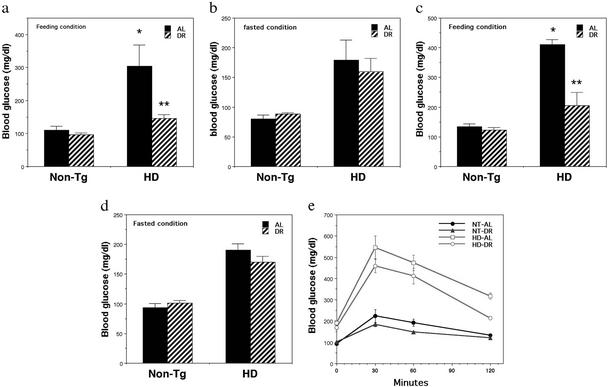
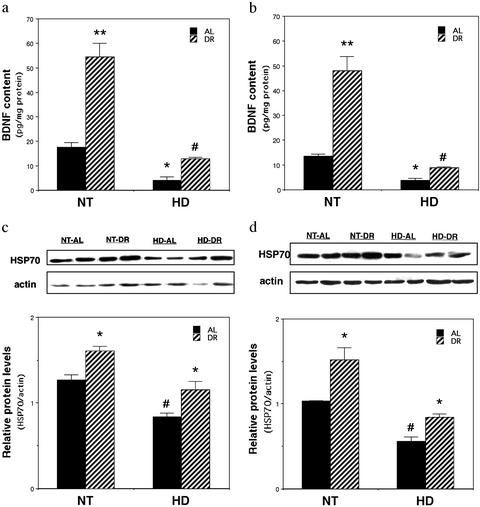
In addition to neurological deficits, Huntington's disease (HD) patients and transgenic mice expressing mutant human huntingtin exhibit reduced levels of brain-derived neurotrophic factor, hyperglycemia, and tissue wasting. We show that the progression of neuropathological (formation of huntingtin inclusions and apoptotic protease activation), behavioral (motor dysfunction), and metabolic (glucose intolerance and tissue wasting) abnormalities in huntingtin mutant mice, an animal model of HD, are retarded when the mice are maintained on a dietary restriction (DR) feeding regimen resulting in an extension of their life span. DR increases levels of brain-derived neurotrophic factor and the protein chaperone heat-shock protein-70 in the striatum and cortex, which are depleted in HD mice fed a normal diet. The suppression of the pathogenic processes by DR in HD mice suggests that mutant huntingtin promotes neuronal degeneration by impairing cellular stress resistance, and that the body wasting in HD is driven by the neurodegenerative process. Our findings suggest a dietary intervention that may suppress the disease process and increase the life span of humans that carry the mutant huntingtin gene.
Figures
Similar articles
-
Compensatory changes in the ubiquitin-proteasome system, brain-derived neurotrophic factor and mitochondrial complex II/III in YAC72 and R6/2 transgenic mice partially model Huntington's disease patients.Hum Mol Genet. 2008 Oct 15;17(20):3144-53. doi: 10.1093/hmg/ddn211. Epub 2008 Jul 17. Hum Mol Genet. 2008. PMID: 18640989 Free PMC article.
-
Reduced expression of the TrkB receptor in Huntington's disease mouse models and in human brain.Eur J Neurosci. 2006 Feb;23(3):649-58. doi: 10.1111/j.1460-9568.2006.04590.x. Eur J Neurosci. 2006. PMID: 16487146
-
CEP-1347 reduces mutant huntingtin-associated neurotoxicity and restores BDNF levels in R6/2 mice.Mol Cell Neurosci. 2008 Sep;39(1):8-20. doi: 10.1016/j.mcn.2008.04.007. Epub 2008 Apr 24. Mol Cell Neurosci. 2008. PMID: 18602275
-
Screening of therapeutic strategies for Huntington's disease in YAC128 transgenic mice.CNS Neurosci Ther. 2012 Jan;18(1):77-86. doi: 10.1111/j.1755-5949.2011.00246.x. CNS Neurosci Ther. 2012. PMID: 21501423 Free PMC article. Review.
-
[Huntington's disease: intracellular signaling pathways and neuronal death].J Soc Biol. 2005;199(3):247-51. doi: 10.1051/jbio:2005026. J Soc Biol. 2005. PMID: 16471265 Review. French.
Cited by
-
Quercetin Affects Erythropoiesis and Heart Mitochondrial Function in Mice.Oxid Med Cell Longev. 2015;2015:836301. doi: 10.1155/2015/836301. Epub 2015 May 28. Oxid Med Cell Longev. 2015. PMID: 26106459 Free PMC article.
-
Do β-defensins and other antimicrobial peptides play a role in neuroimmune function and neurodegeneration?ScientificWorldJournal. 2012;2012:905785. doi: 10.1100/2012/905785. Epub 2012 Apr 19. ScientificWorldJournal. 2012. PMID: 22606066 Free PMC article. Review.
-
Fasting: From Physiology to Pathology.Adv Sci (Weinh). 2023 Mar;10(9):e2204487. doi: 10.1002/advs.202204487. Epub 2023 Feb 3. Adv Sci (Weinh). 2023. PMID: 36737846 Free PMC article. Review.
-
Brain-derived neurotrophic factor regulates the onset and severity of motor dysfunction associated with enkephalinergic neuronal degeneration in Huntington's disease.J Neurosci. 2004 Sep 1;24(35):7727-39. doi: 10.1523/JNEUROSCI.1197-04.2004. J Neurosci. 2004. PMID: 15342740 Free PMC article.
-
The energetics of Huntington's disease.Neurochem Res. 2004 Mar;29(3):531-46. doi: 10.1023/b:nere.0000014824.04728.dd. Neurochem Res. 2004. PMID: 15038601 Review.
References
-
- Andrew S E, Goldberg Y P, Kremer B, Telenius H, Theilmann J, Adam S, Starr E, Squitieri F, Lin B, Kalchman M A, et al. Nat Genet. 1993;7:513–519. - PubMed
-
- Benitez J, Fernandez E, Garcia Ruiz P, Robledo M, Ramos C, Yebenes J. Hum Genet. 1994;94:563–564. - PubMed
-
- Brandt J, Bylsma F W, Gross R, Stine O C, Ranen N, Ross C A. Neurology. 1996;46:527–531. - PubMed
-
- Gu M, Gash M T, Mann V M, Javoy-Agid F, Cooper M, Schapira H V. Ann Neurol. 1996;39:385–389. - PubMed
MeSH terms
Substances
LinkOut - more resources
Full Text Sources
Other Literature Sources
Molecular Biology Databases
