. 2003 Feb 5:3:3.
doi: 10.1186/1471-2148-3-3.

Compensatory mutations cause excess of antagonistic epistasis in RNA secondary structure folding

Affiliations

Compensatory mutations cause excess of antagonistic epistasis in RNA secondary structure folding

Claus O Wilke et al. BMC Evol Biol. .

Abstract

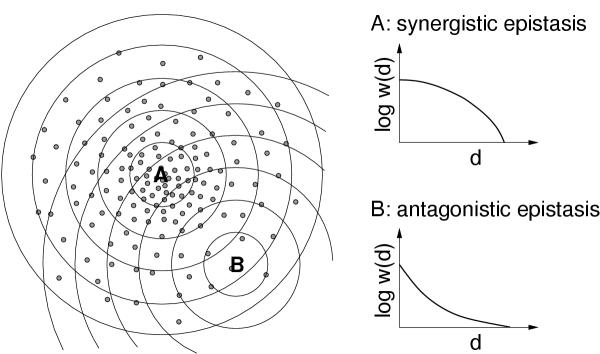
Background: The rate at which fitness declines as an organism's genome accumulates random mutations is an important variable in several evolutionary theories. At an intuitive level, it might seem natural that random mutations should tend to interact synergistically, such that the rate of mean fitness decline accelerates as the number of random mutations is increased. However, in a number of recent studies, a prevalence of antagonistic epistasis (the tendency of multiple mutations to have a mitigating rather than reinforcing effect) has been observed.

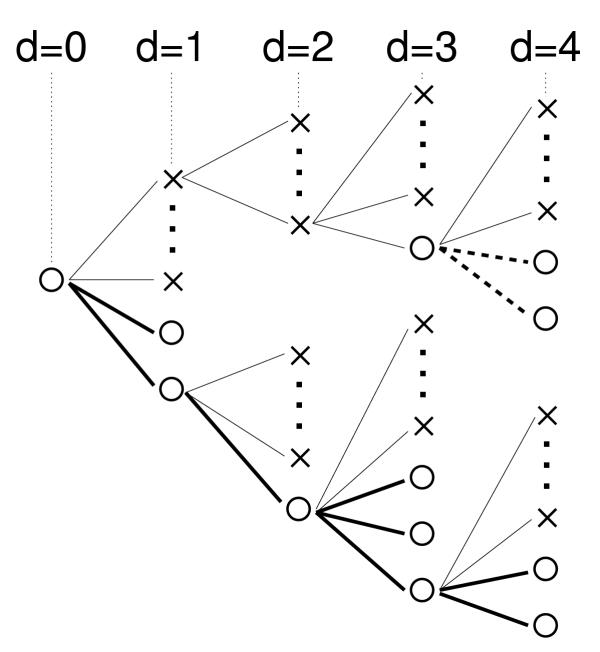
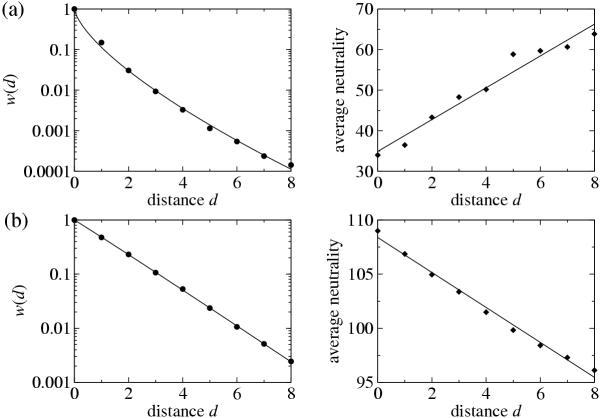
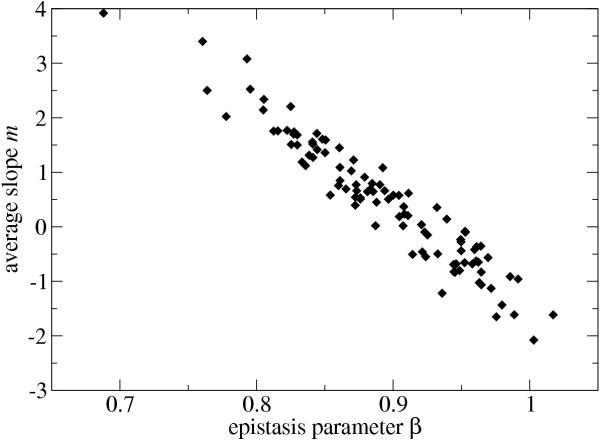
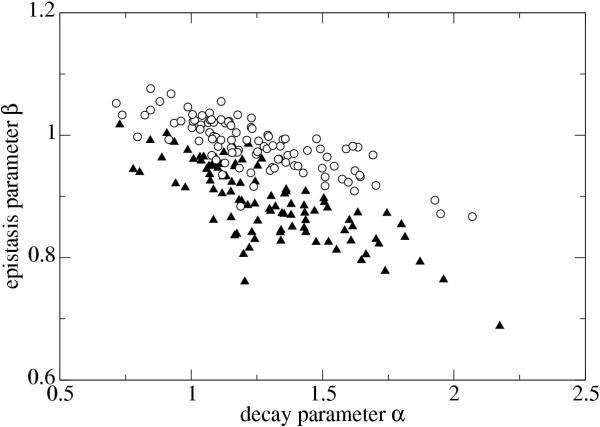
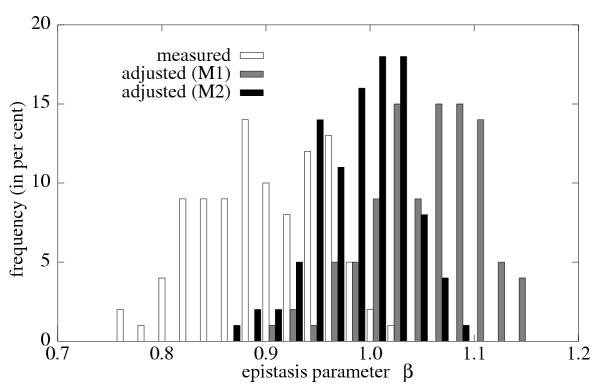
Results: We studied in silico the net amount and form of epistatic interactions in RNA secondary structure folding by measuring the fraction of neutral mutants as a function of mutational distance d. We found a clear prevalence of antagonistic epistasis in RNA secondary structure folding. By relating the fraction of neutral mutants at distance d to the average neutrality at distance d, we showed that this prevalence derives from the existence of many compensatory mutations at larger mutational distances.

Conclusions: Our findings imply that the average direction of epistasis in simple fitness landscapes is directly related to the density with which fitness peaks are distributed in these landscapes.


Figures

Figure 1
Figure 1
Relationship between the distribution of high-fitness sequences and directional epistasis, according to Wilke and Adami [11]. The drawing on the left visualizes genotype space, with the small filled circles representing high-fitness genotypes. A and B are two particular reference sequences, and the concentric rings around A and B indicate the mutants that are a fixed Hamming distance away from either A or B. In the case of A, the average fitness w(d) of the sequences at Hamming distance d from A decays faster at higher d than at lower d, and therefore A shows synergistic epistasis. In the case of B, the decay of w(d) slows down as d increases, and hence B shows antagonistic epistasis.
Figure 2
Figure 2
Schematic drawing of a fitness landscape. Circles represent viable sequences, and crosses represent non-viable ones. The sequence at d = 0 serves as the reference sequence. It has two viable and a number of non-viable mutational neighbors. The viable mutants have further viable and non-viable mutational neighbors, and so on. All viable mutants on the lower branch form a single neutral network. On the upper branch, a new neutral network emerges at a mutational distance d = 3 from the reference sequence.
Figure 3
Figure 3
Function w(d) (left panel) and average neutrality (right panel) at distance d, for two reference sequences. Points are measurements, and lines represent best fits [function exp(- α dβ) for w(d), and function md + n for average neutrality]. (a): A case of strongly antagonistic epistasis (β = 0.688), which is associated with increasing neutrality with d (right panel). (b): A more synergistic case (β = 1.017), and a corresponding decline in neutrality with d.
Figure 4
Figure 4
Correlation between the average change in neutrality, m, and the epistasis parameter, β, for 100 reference RNA sequences. The negative correlation is highly significant (r = -0.960, p < 0.0001).
Figure 5
Figure 5
Functions w(d) (■), wneut(d) (□), and wcomp(d) (*), calculated using method M2, for a representative sequence. The lines merely connect the points to guide the eye.
Figure 6
Figure 6
Epistasis parameter β and decay parameter α for 100 reference RNA sequences, plotted separately for the full fitness function w(d) (triangles) and for the purely neutral contribution wneut(d) (circles, method M2).
Figure 7
Figure 7
Frequency distribution of the epistasis parameter β for measured w(d) and for wneut(d), the latter obtained using two different methods (M1 and M2) to remove the effect of compensatory mutations on w(d). Both methods shift the distribution such that it is roughly centered around 1, in contrast to the strong bias toward antagonism (β < 1) when compensatory mutations are included.

References

    1. Phillips P, Otto S, Whitlock M. Beyond the average: the evolutionary importance of gene interactions and variability of epistatic effects. In: Wolf J, Brodie E, Wade M, editor. Epistasis and the Evolutionary Process. Oxford, UK, Oxford University Press; 2000. pp. 20–38.
    1. Lenski RE, Ofria C, Collier TC, Adami C. Genome complexity, robustness and genetic interactions in digital organisms. Nature. 1999;400:661–664. doi: 10.1038/23245. - DOI - PubMed
    1. Whitlock MC, Phillips PC, Moore FB-G, Tonsor SJ. Multiple fitness peaks and epistasis. Annu Rev Ecol Syst. 1995;26:601–629. doi: 10.1146/annurev.es.26.110195.003125. - DOI
    1. Fenster CB, Galloway LF, Chao L. Epistasis and its consequences for the evolution of natural populations. Trends Ecol Evol. 1997;12:282–286. doi: 10.1016/S0169-5347(97)81027-0. - DOI - PubMed
    1. Wolf J, Brodie E, Wade M, editors Epistasis and the Evolutionary Process. Oxford, UK, Oxford University Press. 2000.

Publication types

LinkOut - more resources