. 2003 Mar 1;411(1):145-57.
doi: 10.1016/s0003-9861(02)00716-6.

Autoxidation of extracellular hydroquinones is a causative event for the cytotoxicity of menadione and DMNQ in A549-S cells

Affiliations

Autoxidation of extracellular hydroquinones is a causative event for the cytotoxicity of menadione and DMNQ in A549-S cells

Nobuo Watanabe et al. Arch Biochem Biophys. .

Abstract

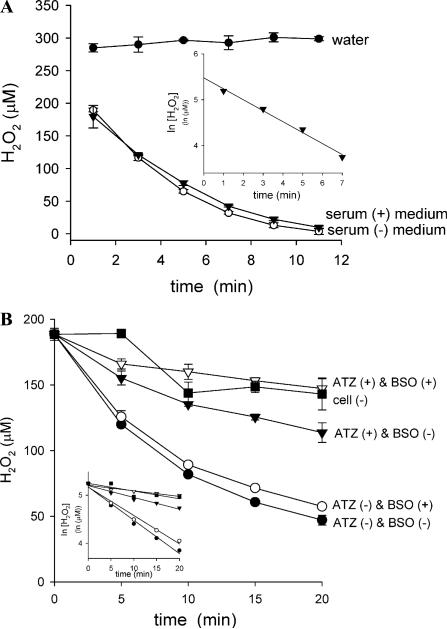
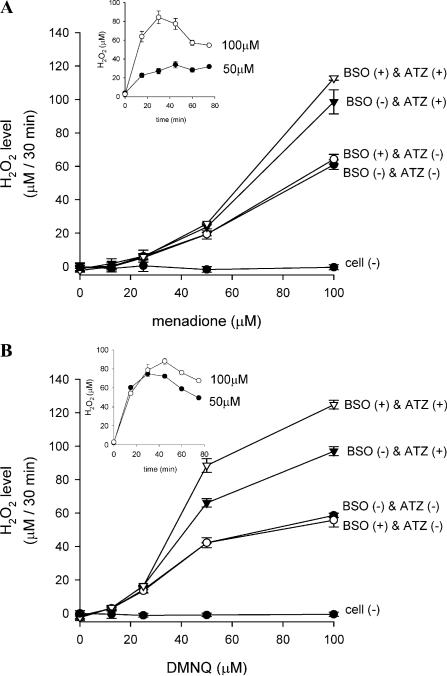
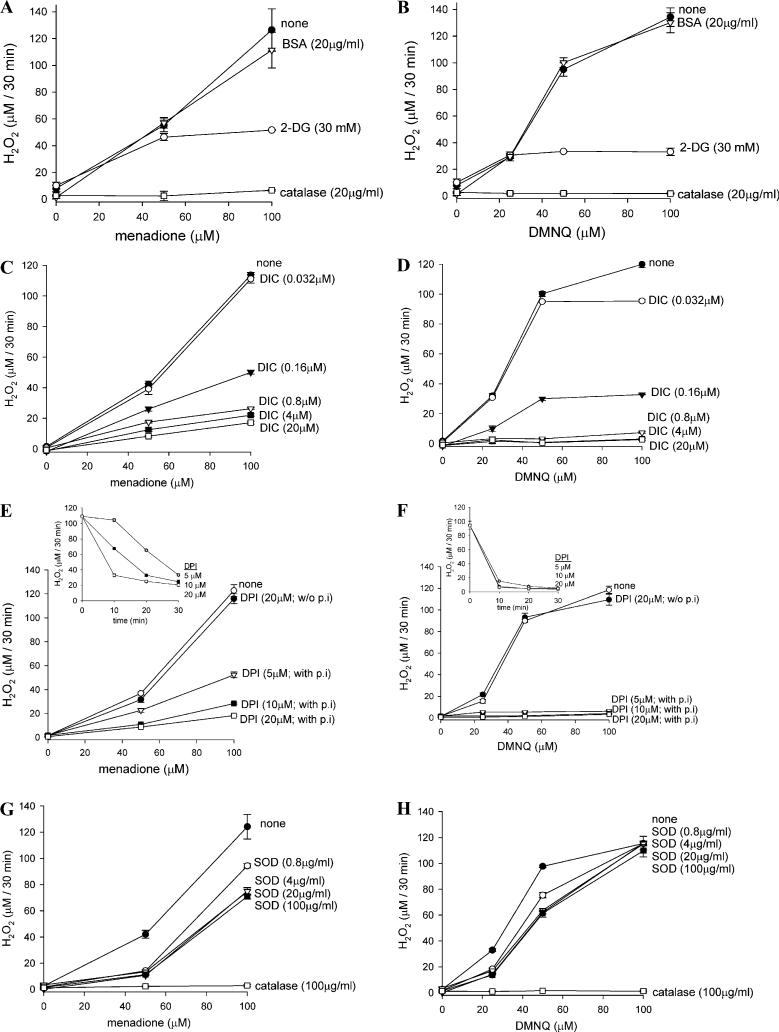
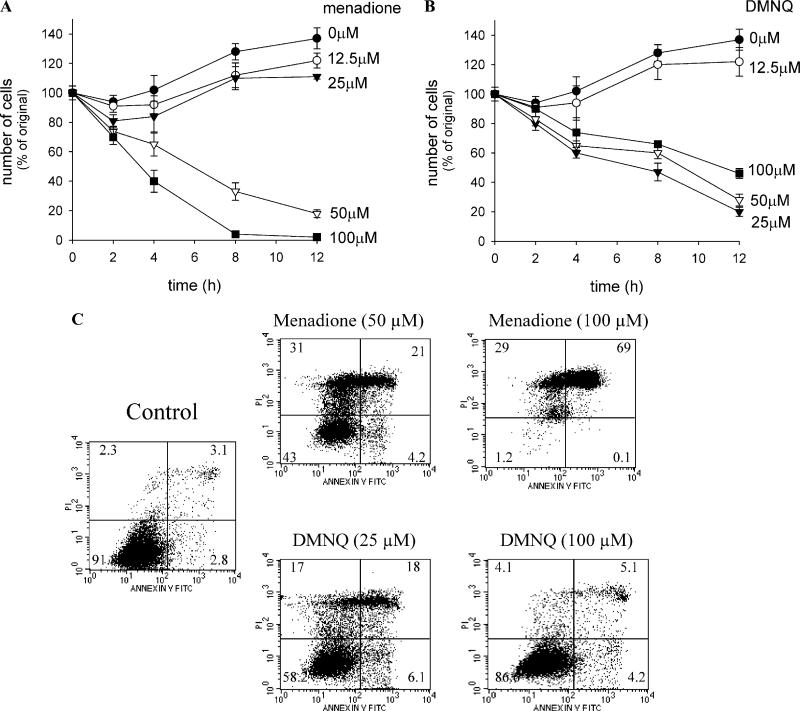
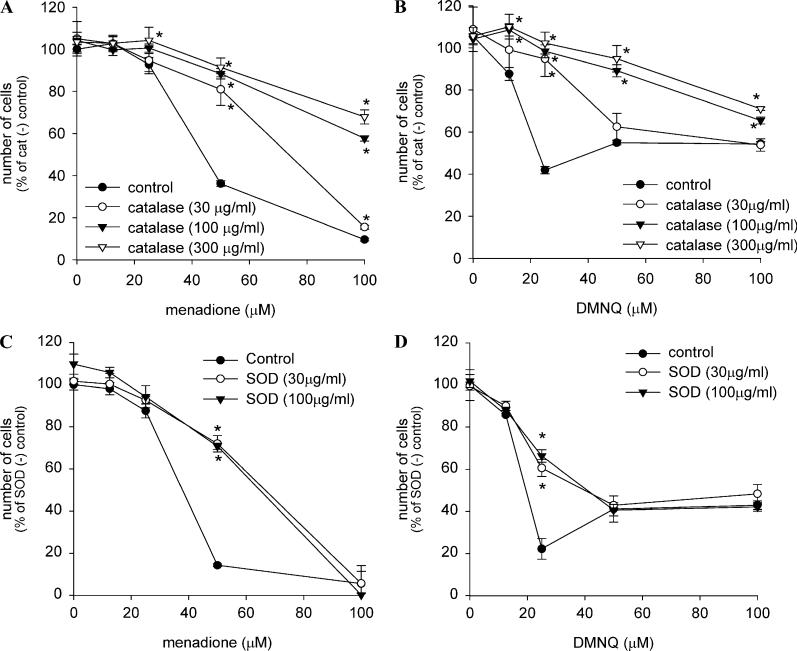
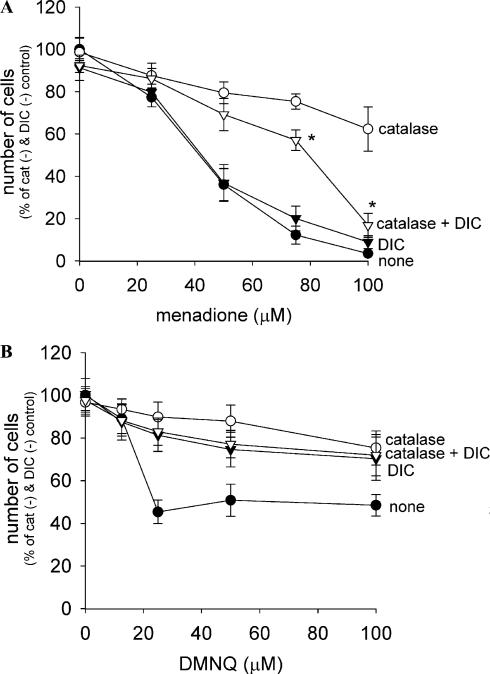
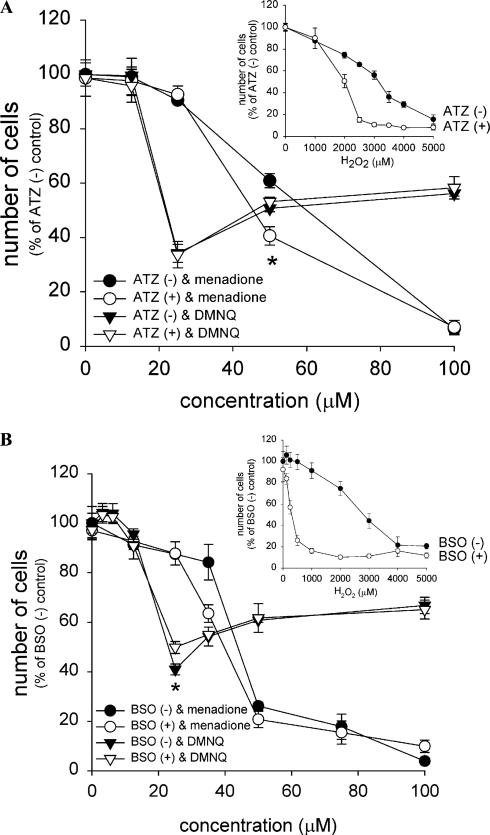
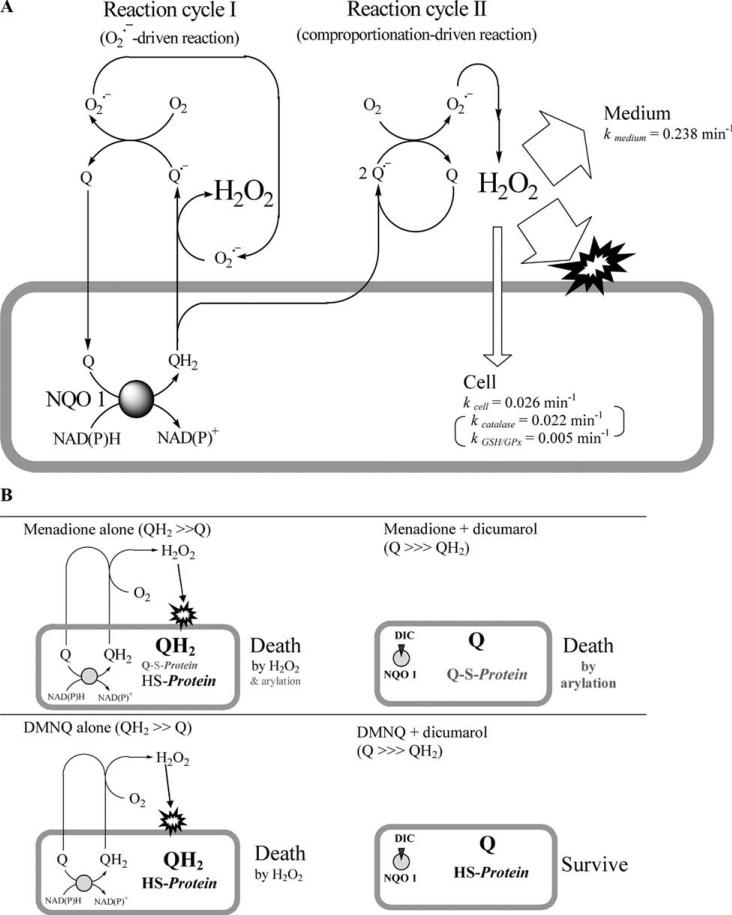
Cytotoxicity of 1,4-naphthoquinones has been attributed to intracellular reactive oxygen species (ROS) generation through one-electron-reductase-mediated redox cycling and to arylation of cellular nucleophiles. Here, however, we report that in a subclone of lung epithelial A549 cells (A549-S previously called A549-G4S (Watanabe, et al., Am. J. Physiol. 283 (2002) L726-736), the mechanism of ROS generation by menadione and by 2,3-dimethoxy-1,4-naphthoquinone (DMNQ), and therefore that of cytotoxicity, differs from the paradigm. Ninety percent of H(2)O(2) generation by both the quinones can be prevented by dicumarol, an inhibitor of NAD(P)H quinone oxidoreductase (NQO1), at the submicromolar level, regardless of the quinone concentrations. Exogenous SOD also inhibits H(2)O(2) production at low but not high concentrations of the quinones, especially DMNQ. Thus, at low quinone concentrations, superoxide-driven hydroquinone autoxidation accounts for more than half of H(2)O(2) generation by both quinones, whereas at high quinone concentrations, especially for DMNQ, comproportionation-driven hydroquinone autoxidation becomes the predominant mechanism. Hydroquinone autoxidation appears to occur predominantly in the extracellular environment than in the cytosol as extracellular catalase can dramatically attenuate quinone-induced cytotoxicity throughout the range of quinone concentrations, whereas complete inactivation of endogenous catalase or complete depletion of intracellular glutathione has only a marginal effect on their cytotoxicity. Finally, we show evidence that ROS production is a consequence of the compensatory defensive role of NQO1 against quinone arylation.


Figures

Fig. 1
Fig. 1
Exogenous H2O2 clearance routes in the cell culture system. (A) H2O2 disappearance in culture medium. H2O2 (300 μM) was incubated at 37 °C in either deionized water, serum-free medium, or serum-containing medium, and the remaining H2O2 was determined by FOX assay. Values are means ± intraassay deviations expressed as range of duplicate determination in a representative experiment. Inset: First-order nature of the disappearance reaction (kmedium = 0.238 min–1). (B) H2O2 removal by the cells at confluent monolayer. Cells in 96-well plates were pretreated with BSO and/or ATZ as described under Materials and methods to inactivate catalase and/or to deplete GSH. After washing, cells were incubated with 50 μl of 200 μM H2O2 in KRP at 37 °C for the indicated period, and remaining H2O2 was determined by FOX assay. Inset: First-order nature of the disappearance reactions. Values were ± intraassay deviations expressed as SD from 3-well cultures in a representative experiment. The apparent rate constant for H2O2 disappearance in KRP (kKRP) is 0.0159 min–1. The net H2O2 consumption by the untreated cells [BSO(–) & ATZ(–)] in this system is 0.053 (kcell=kcellappkKRP). Consumption by catalase and by GSH/GPx are 0.045 min–1 (kcatalase=kATZ()&BSO()appkATZ(+)&BSO()app), and 0.010 min–1 (kGSHGPx=kATZ()&BSO()appkATZ()&BSO(+)app), respectively under the conditions.
Fig. 2
Fig. 2
Relationship between quinone concentrations and H2O2 generation. Cells in 96-well plates were pretreated with BSO and/or ATZ as described to inactivate catalase and/or to deplete GSH. After washing, cells were incubated at 37 °C for 30 min with 50 μl of KRP containing varying concentrations of menadione (A) or DMNQ (B), and H2O2 levels were measured by FOX assay. Values are ± intraassay deviations expressed as SD from 3-well cultures in each representative experiment. Inset: Time course of H2O2 accumulation in KRP of BSO(+) and ATZ(+) cells induced by 50 or 100 μM of each quinone conducted in a separate experiment.
Fig. 3
Fig. 3
Effect of potential quinone metabolism inhibitors on the naphthoquinone-induced H2O2 generation in BSO plus ATZ-treated cells. Cells in 96-well plates were pretreated with BSO and then ATZ to inactivate catalase and deplete GSH, respectively, as described previously. After washing, cells were incubated at 37 °C with menadione (A, C, E, G) or DMNQ (B, D, F, H) together with 2-DG or catalase (A, B), dicumarol (C, D), DPI (E, F), or SOD (G, H) in KRP for 30 min. H2O2 levels were determined by FOX assay. All agents except DPI were added simultaneously with quinones. In (E) and (F), cells were preincubated with 5, 10, or 20 μM DPI for 30 min (designated as “with p.i”), and then the KRP was replaced with fresh KRP containing 100 μM of menadione (E) or DMNQ (F) and incubated for further 30 min. Note that without preincubation, even 20 μM DPI (designated as “w/o p.i”) had no inhibitory effect on H2O2 generation. Insets: Time course of DPI inactivation of H2O2-producing capacity of cells. All values are means ± intraassay deviations expressed as SD from 3-well cultures in each representative experiment.
Fig. 4
Fig. 4
Time course of cell death induced by naphthoquinones in A549-S cells. Cells in 96-well plates were incubated for indicated time with 100 μl of culture medium containing varying concentrations of menadione (A) or DMNQ (B), and the viable cells were detected by crystal violet staining as described under Materials and methods. The initial cell number was expressed as 100%. Values are means ± intraassay deviations expressed as SD from 8-well (t = 0) or 4-well (other time points) cultures in a representative experiment. (C) Annexin V binding and PI staining of the dying cells 4 h after treatment with each quinone. Figures show one experiment conducted in duplicate. The number in each quadrant represents the percentage of the cell population (average of duplicate experiments).
Fig. 5
Fig. 5
Effect of various agents on naphthoquinone-induced cell death in A549-S cells. Cells were incubated with menadione (A, C) or DMNQ (B, D) together with the indicated concentration of catalase (A, B) or SOD (C, D) in culture medium for 7 h. The number of viable cells was measured as in Fig. 4. Values are means ± intraassay deviations expressed as SD from three-well cultures in each representative experiment. *Significant difference (P < 0.05) from control at each quinone concentration.
Fig. 6
Fig. 6
Effect of dicumarol on the cytoprotective effect of catalase against naphthoquinone-induced cell death in A549-S cells. Cells were preincubated without or with 20 μM dicumarol in culture medium for 30 min. The media were then replaced with fresh media containing either menadione (A) or DMNQ (B) and catalase (300 μg/ml) and/or dicumarol (20 μM). The number of viable cells was measured 7 h later as described in Fig. 4. Values are means ± intraassay deviations expressed as SD from three-well cultures in each representative experiment. *Significant difference (P < 0:05) between the presence of catalase and catalase plus dicumarol at each quinone concentration.
Fig. 7
Fig. 7
Effect of endogenous catalase inactivation and/or GSH depletion on naphthoquinone-induced cell death in A549-S cells. Cells in 96-well plates were pretreated with aminotriazole (A) or BSO (B) as described under Materials and methods, and then the cells were exposed to H2O2 (A,B; insets) or menadione or DMNQ (A,B) in culture medium for 7 h. The number of viable cells was measured as described in Fig. 4. Values are means ± intraassay deviations expressed as SD from 3-well cultures in each representative experiment. *Significant difference (P < 0:05) between non-ATZ-treated and non-BSO-treated cells at each quinone concentration.
Fig. 8
Fig. 8
Presumable model for H2O2 generation via trans-plasma membrane redox cycling of naphthoquinones in A549-S cells. (A) The trans-plasma membrane redox cycling of naphthoquinone. On exposure, naphthoquinone (menadione and DMNQ; represented as Q) get into cells where they are predominantly reduced by two electrons by NQO1 to the corresponding hydroquinone (QH2). The accumulated QH2 diffuse out across the plasma membrane where they undergo autoxidation. Initially, a trace amount of O2. oxidizes QH2, generating semiquinone radical (Q.) and H2O2. Q. then reduces O2, producing O2. and the original Q. O2. in turn oxidizes other QH2 diffusing out of the cells. Q repeats this cycle, with concomitant production of H2O2 (reaction cycle I). Thus, O2. acts as a propagating species and therefore extracellular SOD can prevent the cycle. This O2.-driven QH2 autoxidation is unlikely to occur in the cytosol because of the presence of CuZnSOD. QH2 is also oxidized by Q to form Q. in comproportionation reaction. The resulting Q. also becomes the source of electrons for producing H2O2 (reaction cycle II). Both reaction cycle I and reaction cycle II can proceed in tandem. However, when cells are exposed to high concentrations of Q, reaction cycle II become predominant in the autoxidation process, and this is more favored for DMNQ than for menadione. SOD can no longer prevent H2O2 generation by this process. By contrast, dicumarol, DPI, and 2-DG can inhibit H2O2 generation, regardless of the elementary reactions of autoxidation, by blocking QH2 formation by NQO1. Ninety percent of extracellular H2O2 thus generated through the autoxidation of QH2 is eliminated by the culture medium, and only 10% can get into the cells. (kmedium = 0.238 min–1 vs kcell = 0.026 min–1, The pseudo-first-order rate constant, kcell, here was calculated from the value obtained in Fig. 1 and accounting for a doubling of the volume in these experiments.) Therefore, oxidative damage by H2O2 is possible only on the outer surface of the plasma membrane, the site of H2O2 generation. For this reason, endogenous catalase and GSH/GPx play no protective roles against the Q-derived extracellular H2O2 toxicity, whereas catalase added to the medium can dramatically attenuate the cytotoxicity. The oxidative membrane damage, together with other signals from Q, such as arylation in the case of menadione, causes cell death. (B) Change in the mechanism of cytotoxicity of menadione. Left: Due to NQO1 activity, Q is reduced in the cytosol to QH2. This prevents cellular components from being arylated by Q with arylating capacity such as menadione. However, QH2 diffuses out of the cells and generates ROS, leading to cytotoxicity. Right: When QH2 formation is prevented by inhibition of NQO1 activity by dicumarol, DPI, or 2-DG, the cytosolic Q remains unreduced. Although ROS production is also prevented, Q arylates cellular components, leading to toxicity. Extracellular SOD can protect cells from the cytotoxicity of menadione, as well as DMNQ, at low quinone concentrations because the enzyme decreases H2O2 generation from QH2 but does not inhibit NQO1 activity.

Similar articles

Cited by

References

    1. Thor H, Smith MT, Hartzell P, Bellomo G, Jewell SA, Orrenius S. J. Biol. Chem. 1982;257:12419–12425. - PubMed
    1. Shi M, Gozal E, Choy HA, Forman HJ. Free Radicals Biol. Med. 1993;15:57–67. - PubMed
    1. Gant TW, Rao DN, Mason RP, Cohen GM. Chem. Biol. Interact. 1988;65:157–173. - PubMed
    1. Shi MM, Kugelman A, Iwamoto T, Tian L, Forman HJ. J. Biol. Chem. 1994;269:26512–26517. - PubMed
    1. Liu RM, Shi MM, Giulivi C, Forman HJ. Am. J. Physiol. 1998;274:L330–L336. - PubMed

Publication types