

Multiple light inputs control phototaxis in Synechocystis sp. strain PCC6803
- PMID: 12591877
- PMCID: PMC148062
- DOI: 10.1128/JB.185.5.1599-1607.2003
Multiple light inputs control phototaxis in Synechocystis sp. strain PCC6803
Abstract
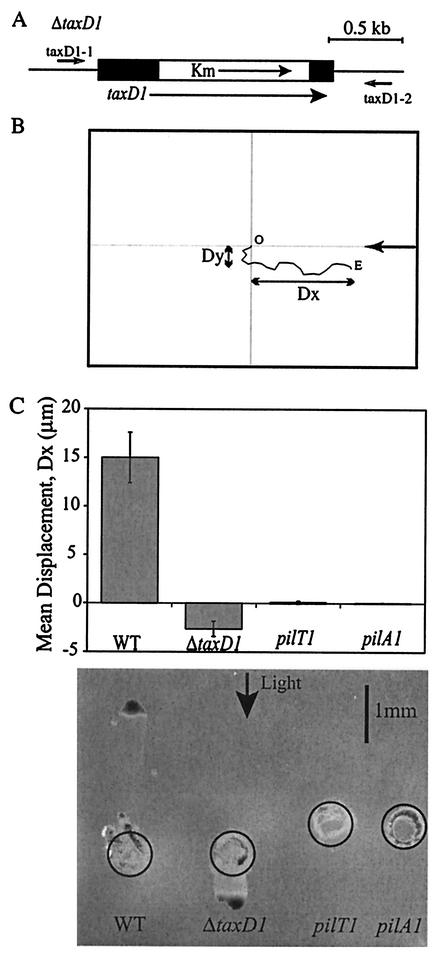
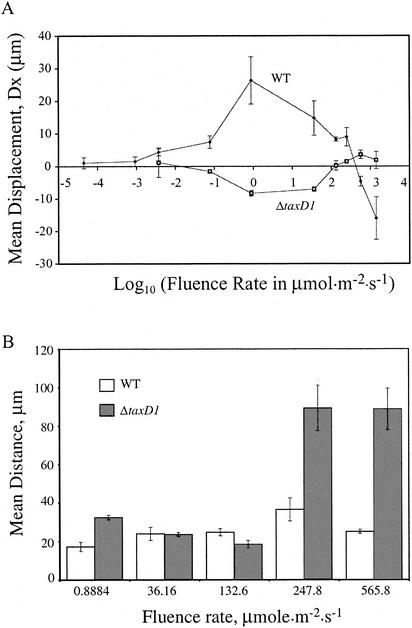
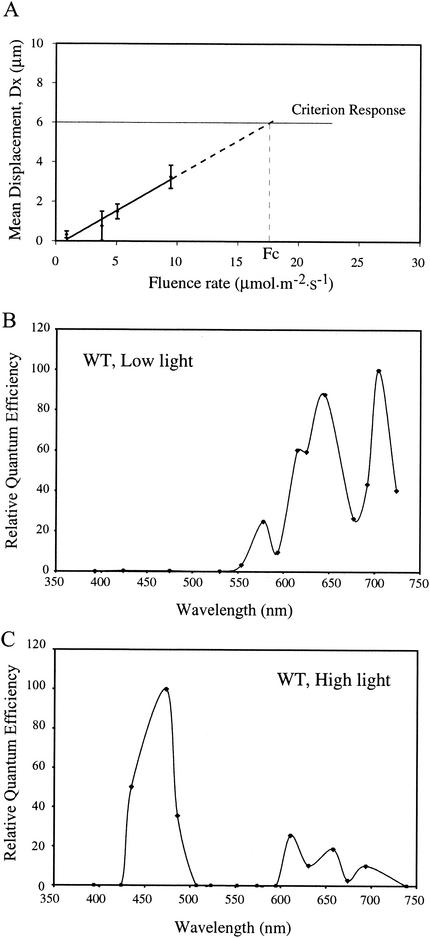
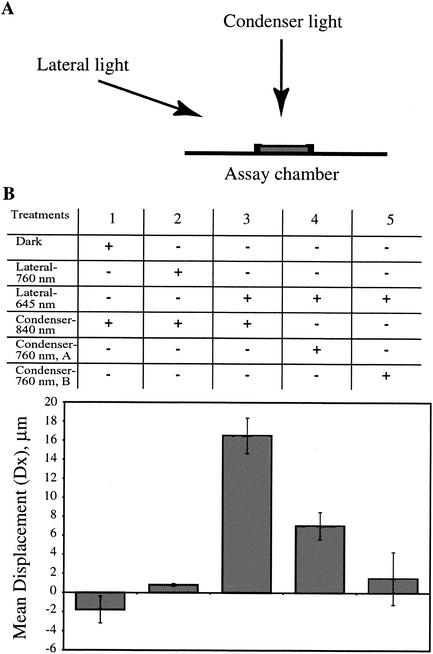
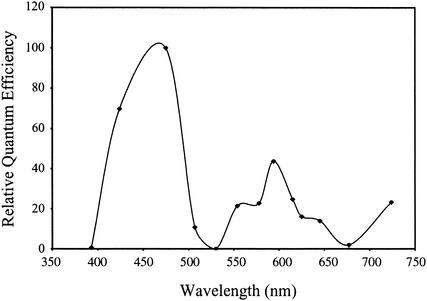
The phototactic behavior of individual cells of the cyanobacterium Synechocystis sp. strain PCC6803 was studied with a glass slide-based phototaxis assay. Data from fluence rate-response curves and action spectra suggested that there were at least two light input pathways regulating phototaxis. We observed that positive phototaxis in wild-type cells was a low fluence response, with peak spectral sensitivity at 645 and 704 nm. This red-light-induced phototaxis was inhibited or photoreversible by infrared light (760 nm). Previous work demonstrated that a taxD1 mutant (Cyanobase accession no. sll0041; also called pisJ1) lacked positive but maintained negative phototaxis. Therefore, the TaxD1 protein, which has domains that are similar to sequences found in both bacteriophytochrome and the methyl-accepting chemoreceptor protein, is likely to be the photoreceptor that mediates positive phototaxis. Wild-type cells exhibited negative phototaxis under high-intensity broad-spectrum light. This phenomenon is predominantly blue light responsive, with a maximum sensitivity at approximately 470 nm. A weakly negative phototactic response was also observed in the spectral region between 600 and 700 nm. A deltataxD1 mutant, which exhibits negative phototaxis even under low-fluence light, has a similar action maximum in the blue region of the spectrum, with minor peaks from green to infrared (500 to 740 nm). These results suggest that while positive phototaxis is controlled by the red light photoreceptor TaxD1, negative phototaxis in Synechocystis sp. strain PCC6803 is mediated by one or more (as yet) unidentified blue light photoreceptors.
Figures
Similar articles
-
Genetics of the Blue Light-Dependent Signal Cascade That Controls Phototaxis in the Cyanobacterium Synechocystis sp. PCC6803.Plant Cell Physiol. 2017 Mar 1;58(3):458-465. doi: 10.1093/pcp/pcw218. Plant Cell Physiol. 2017. PMID: 28028165
-
The role of cyanopterin in UV/blue light signal transduction of cyanobacterium Synechocystis sp. PCC 6803 phototaxis.Plant Cell Physiol. 2010 Jun;51(6):969-80. doi: 10.1093/pcp/pcq059. Epub 2010 Apr 23. Plant Cell Physiol. 2010. PMID: 20418333
-
[Inversion of phototaxis in cells of Synechocystis sp. PCC 6803 determined by a mutation in the regulatory gene prqR].Genetika. 2008 Apr;44(4):474-82. Genetika. 2008. PMID: 18666550 Russian.
-
Photosystems and photoreceptors in cyanobacterial phototaxis and photophobotaxis.FEBS Lett. 2024 Aug;598(15):1899-1908. doi: 10.1002/1873-3468.14968. Epub 2024 Jun 30. FEBS Lett. 2024. PMID: 38946046 Review.
-
Cyanobacteria in motion.Curr Opin Plant Biol. 2017 Jun;37:109-115. doi: 10.1016/j.pbi.2017.03.018. Epub 2017 May 1. Curr Opin Plant Biol. 2017. PMID: 28472718 Review.
Cited by
-
Phytochromes in Agrobacterium fabrum.Front Plant Sci. 2021 Apr 29;12:642801. doi: 10.3389/fpls.2021.642801. eCollection 2021. Front Plant Sci. 2021. PMID: 33995441 Free PMC article. Review.
-
Emergent Phototactic Responses of Cyanobacteria under Complex Light Regimes.mBio. 2017 Mar 7;8(2):e02330-16. doi: 10.1128/mBio.02330-16. mBio. 2017. PMID: 28270586 Free PMC article.
-
The Role of the Cyanobacterial Type IV Pilus Machinery in Finding and Maintaining a Favourable Environment.Life (Basel). 2020 Oct 23;10(11):252. doi: 10.3390/life10110252. Life (Basel). 2020. PMID: 33114175 Free PMC article. Review.
-
Beyond movement: the dynamic roles of Type IV pili in cyanobacterial life.J Bacteriol. 2025 Jul 24;207(7):e0008625. doi: 10.1128/jb.00086-25. Epub 2025 Jul 3. J Bacteriol. 2025. PMID: 40607810 Free PMC article. Review.
-
Application of Multi-Omics Technologies to the Study of Phytochromes in Plants.Antioxidants (Basel). 2024 Jan 14;13(1):99. doi: 10.3390/antiox13010099. Antioxidants (Basel). 2024. PMID: 38247523 Free PMC article. Review.
References
-
- Bhaya, D., N. R. Bianco, D. Bryant, and A. Grossman. 2000. Type IV pilus biogenesis and motility in the cyanobacterium Synechocystis sp. PCC6803. Mol. Microbiol 37:941-951. - PubMed
-
- Bhoo, S. H., S. J. Davis, J. Walker, B. Karniol, and R. D. Vierstra. 2001. Bacteriophytochromes are photochromic histidine kinases with a biliverdin chromophore. Nature 414:776-779. - PubMed
Publication types
MeSH terms
Substances
LinkOut - more resources
Full Text Sources
