. 2003 Feb 17;160(4):517-28.
doi: 10.1083/jcb.200210021.

The molecular function of Ase1p: evidence for a MAP-dependent midzone-specific spindle matrix. Microtubule-associated proteins

Affiliations

The molecular function of Ase1p: evidence for a MAP-dependent midzone-specific spindle matrix. Microtubule-associated proteins

Scott C Schuyler et al. J Cell Biol. .

Abstract

The midzone is the domain of the mitotic spindle that maintains spindle bipolarity during anaphase and generates forces required for spindle elongation (anaphase B). Although there is a clear role for microtubule (MT) motor proteins at the spindle midzone, less is known about how microtubule-associated proteins (MAPs) contribute to midzone organization and function. Here, we report that budding yeast Ase1p is a member of a conserved family of midzone-specific MAPs. By size exclusion chromatography and velocity sedimentation, both Ase1p in extracts and purified Ase1p behaved as a homodimer. Ase1p bound and bundled MTs in vitro. By live cell microscopy, loss of Ase1p resulted in a specific defect: premature spindle disassembly in mid-anaphase. Furthermore, when overexpressed, Ase1p was sufficient to trigger spindle elongation in S phase-arrested cells. FRAP revealed that Ase1p has both a very slow rate of turnover within the midzone and limited lateral diffusion along spindle MTs. We propose that Ase1p functions as an MT cross-bridge that imparts matrix-like characteristics to the midzone. MT-dependent networks of spindle midzone MAPs may be one molecular basis for the postulated spindle matrix.


Figures

Figure 1.
Figure 1.
Ase1p is a member of a conserved family of spindle midzone MAPs. (A) Domain structure of Ase1p-related proteins; CC indicates predicted coiled-coil motifs, CM indicates the conserved motif, DB indicates the destruction box. (B) A neighbor-joining tree and the pair-wise identity between nearest neighbors of Ase1p-related proteins. There is a large set of proteins highly related to the tobacco MAP65 family predicted from ORFs in Arabidopsis that are not included in this diagram. (C) Amino acid sequence of the most highly conserved motif. Conserved (*) and similar (:) residues are marked. (D) GFP–Ase1p complements the temperature-sensitive synthetic lethality of an ase1Δ bni1Δ (Lee et al., 1999), whereas GFP–Ase1p-CM does not. (E) GFP–Ase1p-CM fails to localize properly to the spindle midzone. Shown are images of mitotic cells expressing GFP–Ase1p or GFP–Ase1p-CM. (F) Ase1p-CM is expressed at comparable levels to Ase1p.
Figure 2.
Figure 2.
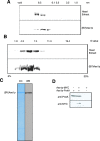
Ase1p is a homodimer. (A) Analytical gel filtration of Ase1p in a native yeast extract or purified (BV)Ase1p. Stokes' radii of protein standards are indicated above the blots. (B) Sucrose gradients of Ase1p in a native yeast extract or purified (BV)Ase1p. Svedberg coefficients for the proteins used as globular standards are shown above the blots. (C) Purified (BV)Ase1p from Sf9 cells. Purified (BV)Ase1p was run on an SDS-PAGE gel and visualized by colloidal Coomassie (CC) staining or Western blotting (WB). (D) An anti-ProtA coimmunoprecipitation shows that Ase1p–ProtA coimmunoprecipitates Ase1p–MYC. Anti-IgG (upper) and anti-MYC (lower) Western blots are shown.
Figure 3.
Figure 3.
Ase1p is an MT-binding protein. (A) In vitro–translated Ase1p copellets with 28 μM Taxol-stabilized MTs (s, supernatant; p, pellet). The maximum percent bound in this assay is 75%. (B) Copelleting of in vitro–transcripted/translated Ase1p with a serial dilution of Taxol-stabilized MTs to determine the binding constant.
Figure 4.
Figure 4.
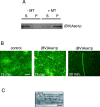
Ase1p is an MT bundling protein. (A) Purified (BV)Ase1p binds MTs directly. 2.5 μg of (BV)Ase1p was bound to Taxol-stabilized MTs as in Fig. 3 A (s, supernatant; p, pellet). (B) Ase1p bundles MTs. Pure recombinant protein was mixed with Oregon green–labeled MTs (Bar, 5 μm). (C) Electron micrograph of MT bundles prepared by negative staining of samples incubated for 15 min with (BV)Ase1p or buffer only control (inset) (Bars, 50 nm).
Figure 5.
Figure 5.
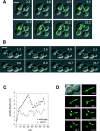
Ase1p is required for anaphase spindle stability. (A) Anaphase in a wild-type cell. MTs are labeled with GFP–Tub1p. Numbers indicate the time in minutes (Bar, 5 μm). (B) Anaphase in ase1Δ cells. Arrow indicates spindle collapse. (C) Spindle length in wild-type and ase1Δ cells. The examples shown are for the wild-type cell on the right in A and the ase1Δ cell on the left in B. (D) Single focal plane imaging of an ase1Δ cell during mid-anaphase. Arrow indicates the end of the depolymerizing spindle MTs. Numbers indicate the time in seconds (Bar, 2.5 μm).
Figure 6.
Figure 6.
Ase1p overexpression induces spindle elongation in HU-arrested cells. (A) Measurements of spindle length upon the overproduction of Ase1p in HU-arrested cells. The average spindle lengths for vector only control are shown in open columns, and the average spindle lengths for Ase1p-overexpressing cells are in dark gray columns. More then 60 cells were counted at each time point. Error bars show standard deviations of the means. (B) Images of Ase1p-overexpressing cells at the indicated time points. HU was used at a final concentration of 200 mM (Bar, 2 μm). (C) Ase1p overexpression does not induce cell cycle progression. Shown are Western blots of extracts from the indicated time points probed with rabbit polyclonal antibodies against the indicated proteins.
Figure 7.
Figure 7.
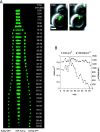
Ase1p localization during spindle elongation. (A) A kymograph of GFP–Ase1p and Nuf2p–GFP localization during anaphase B. As the spindle elongates, the Ase1p bar decreases in length. Numbers indicate the time in minutes (Bar, 2 μm). (B) The area occupied by Ase1p in the spindle midzone decreases during anaphase. The average area of GFP–Ase1p signal and the average fluorescence intensity (grayscale values per pixel) of Ase1p are plotted versus time, for the cell shown in A. The area occupied by one pixel in these images is 0.004 μm2.
Figure 8.
Figure 8.
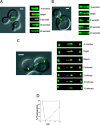
Slow turnover of Ase1p at the spindle midzone. (A) FRAP of Cin8–GFP in an anaphase cell. Red dot indicates the area targeted by the laser. Time points are indicated in seconds (Bar, 2 μm). (B) FRAP of Cin8–GFP in an ase1Δ anaphase cell. (C) FRAP of GFP–Ase1p in an anaphase cell. Time points are in minutes relative to the time of bleaching. Red dot indicates the area targeted by the laser (Bar, 2 μm). (D) Fluorescence intensity of a 0.35 μm2 area at intervals after photobleaching. The values were normalized to the initial fluorescence intensity.

References

    1. Adams, R.R., M. Carmena, and W.C. Earnshaw. 2001. Chromosomal passengers and the (aurora) ABCs of mitosis. Trends Cell Biol. 11:49–54. - PubMed
    1. Aist, J.R., and M.W. Berns. 1981. Mechanics of chromosome separation during mitosis in Fusarium (Fungi imperfecti): new evidence from ultrastructural and laser microbeam experiments. J. Cell Biol. 91:446–458. - PMC - PubMed
    1. Aist, J.R., C.J. Bayles, W. Tao, and M.W. Berns. 1991. Direct experimental evidence for the existence, structural basis, and function of astral forces during anaphase B in vivo. J. Cell Sci. 100:279–288. - PubMed
    1. Aist, J.R., H. Liang, and M.W. Berns. 1993. Astral and spindle forces in PtK2 cells during anaphase B: a laser microbeam study. J. Cell Sci. 104:1207–1216. - PubMed
    1. Altschul, S.F., and W. Gish. 1996. Local alignment statistics. Methods Enzymol. 266:460–480. - PubMed

Publication types

MeSH terms

Substances