

Insulin resistance is a poor predictor of type 2 diabetes in individuals with no family history of disease
- PMID: 12591951
- PMCID: PMC151408
- DOI: 10.1073/pnas.0438009100
Insulin resistance is a poor predictor of type 2 diabetes in individuals with no family history of disease
Erratum in
- Proc Natl Acad Sci U S A. 2003 Apr 15;100(8):4970
Abstract
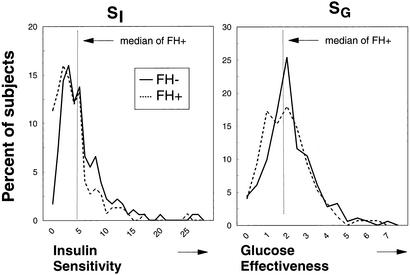
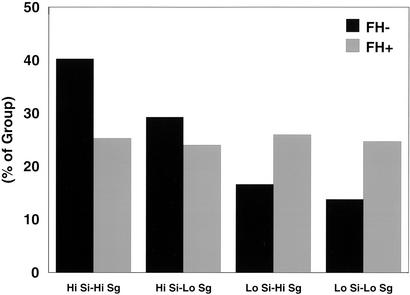
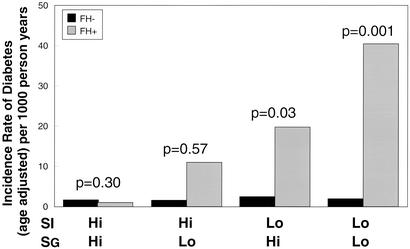
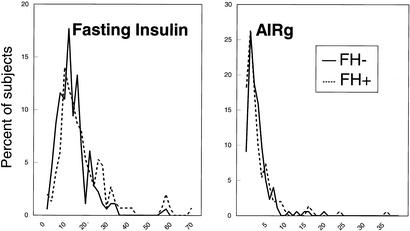
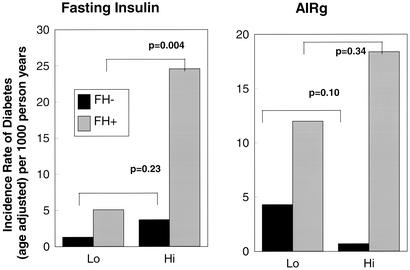
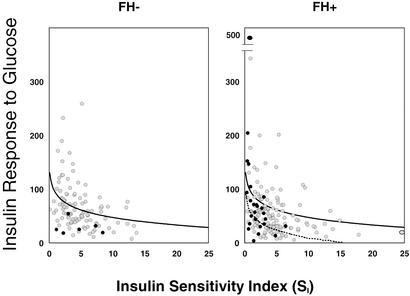
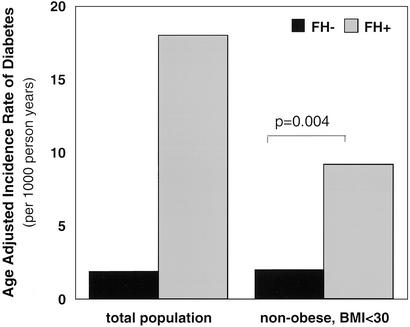
In normoglycemic offspring of two type 2 diabetic parents, low insulin sensitivity (S(I)) and low insulin-independent glucose effectiveness (S(G)) predict the development of diabetes one to two decades later. To determine whether low S(I), low S(G,) or low acute insulin response to glucose are predictive of diabetes in a population at low genetic risk for disease, 181 normoglycemic individuals with no family history of diabetes (FH-) and 150 normoglycemic offspring of two type 2 diabetic parents (FH+) underwent i.v. glucose tolerance testing (IVGTT) between the years 1964-82. During 25 +/- 6 years follow-up, comprising 2,758 person years, the FH- cohort (54 +/- 9 years) had an age-adjusted incidence rate of type 2 diabetes of 1.8 per 1,000 person years, similar to that in other population-based studies, but significantly lower than 16.7 for the FH+ cohort. Even when the two study populations were subdivided by initial values of S(I) and S(G) derived from IVGTT's performed at study entry, there was a 10- to 20-fold difference in age-adjusted incidence rates for diabetes in the FH- vs. FH+ individuals with low S(I) and low S(G). The acute insulin response to glucose was not predictive of the development of diabetes when considered independently or when assessed as a function of S(I), i.e., the glucose disposition index. These data demonstrate that low glucose disposal rates are robustly associated with the development of diabetes in the FH+ individuals, but insulin resistance per se is not sufficient for the development of diabetes in individuals without family history of disease and strongly suggest a familial factor, not detectable in our current measures of the dynamic responses of glucose or insulin to an IVGTT is an important risk factor for type 2 diabetes. Low S(I) and low S(G), both measures of glucose disposal, interact with this putative familial factor to result in a high risk of type 2 diabetes in the FH+ individuals, but not in the FH- individuals.
Figures
References
-
- DeFronzo R A. Diabetes. 1988;37:667–687. - PubMed
-
- Rossetti L, Giaccari A, DeFronzo R A. Diabetes Care. 1990;13:610–630. - PubMed
-
- Warram J H, Martin B C, Soeldner J S, Krolewski A S. Adv Exp Med Biol. 1988;246:175–179. - PubMed
-
- Watanabe R M, Valle T, Hauser E R, Ghosh S, Eriksson J, Kohtamaki K, Ehnholm C, Tuomilehto J, Collins F S, Bergman R N, et al. Hum Hered. 1999;49:159–168. - PubMed
-
- Haffner S M, Stern M P, Hazuda H P, Pugh J A, Patterson J K. N Engl J Med. 1986;315:220–224. - PubMed
Publication types
MeSH terms
Substances
Grants and funding
LinkOut - more resources
Full Text Sources
Medical
Miscellaneous
