. 2003 Mar 4;100(5):2526-31.
doi: 10.1073/pnas.0437998100. Epub 2003 Feb 18.

Infertility and aneuploidy in mice lacking a type IA DNA topoisomerase III beta

Affiliations

Infertility and aneuploidy in mice lacking a type IA DNA topoisomerase III beta

Kelvin Y Kwan et al. Proc Natl Acad Sci U S A. .

Abstract

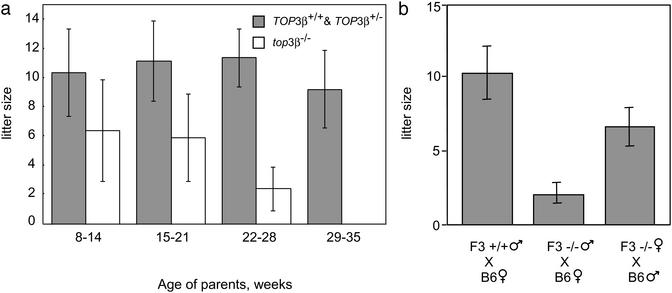
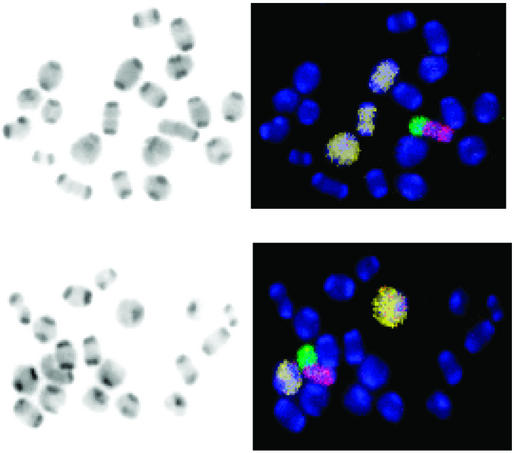
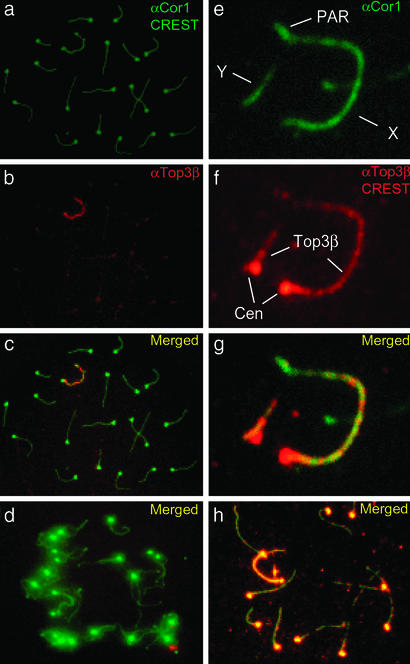
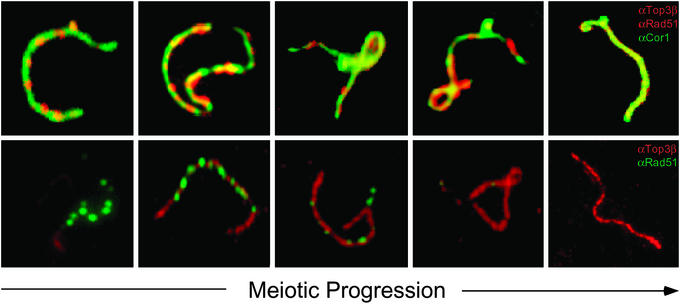
We report that disruption of the mouse TOP3 beta gene encoding DNA topoisomerase III beta, one of the two mammalian type IA DNA topoisomerases, leads to a progressive reduction in fecundity. The litter size in crosses of top3 beta(-/-) mice decreases over time and through successive generations, and this decrease seems to reflect embryonic death rather than impaired fertilization. These observations are suggestive of a gradual accumulation of chromosomal defects in germ cells lacking DNA topoisomerase III beta, and this interpretation is supported by the observation of a high incidence of aneuploidy in the spermatocytes of infertile top3 beta(-/-) males. Cytogenetic examination of spermatocytes of wild-type mice also indicates that DNA topoisomerase III beta becomes prominently associated with the asynaptic regions of the XY bivalents during pachytene, and that there is a time lag between the appearance of chromosome-bound DNA topoisomerase III beta and Rad51, a protein known to be involved in an early step of homologous recombination. We interpret these findings, together with the known mechanistic characteristics of different subfamilies of DNA topoisomerases, in terms of a specific role of a type IA DNA topoisomerase in the resolution of meiotic double-Holliday junctions without crossing over. This interpretation is most likely applicable to mitotic cells as well and can explain the universal presence of at least one type IA DNA topoisomerase in all organisms.


Figures

Figure 1
Figure 1
Average litter size as a function of the age of the parents. (a) Each of the mating pairs was kept in a separate cage, and births over a 6-month period were monitored. Data for births during successive 6-week periods (one to two litters) were grouped together, and the average litter size of top3β−/− mice was calculated from data recorded for three mating pairs 8 weeks of age at the start of the experiment. The control group included two TOP3β+/+ and one top3β+/− mating pairs that were littermates of the top3β−/− mice. No significant difference in litter size was observed among the TOP3β+/+ and top3β+/− pairs, and thus data for the control group were combined. Error bars represent SDs. (b) Average litter sizes of crosses between male F3 TOP3β+/+ mice and female C57BL/6T mice (left bar), male F3 top3β−/− and female C57BL/6T mice (middle bar), and female F3 top3β−/− and male C57BL/6T mice (right bar). F3 refers to third generation offspring from the founding chimeras. A minimum of three mating pairs were used in each combination, and mating was started and ended at 8 and 36 weeks of age, respectively. Error bars represent SDs.
Figure 2
Figure 2
Two examples of M I chromosomes of TOP3β+/+ and top3β−/− mouse testicular cells. Two 6-month-old TOP3β+/+ and five 3- to 6-month-old top3β−/− mice were used to generate metaphase chromosomes. Hypotonically treated cells were fixed in methanol:acetic acid (3:1 vol:vol), and chromosome spreads on glass slides were prepared. Fluorescence in situ hybridization with a mixture of differently tagged probes was then carried out, and the chromosomes were also stained with DAPI before viewing in a fluorescence microscope. (Left) The DAPI stain in black and white. (Right) The merged fluorescence images, with the Cy5-painted chromosomes 1, 3, and 16 in pale yellow, the Cy3-painted X chromosome in red, the FITC-painted Y chromosome in green, and the other chromosomes in blue. (Upper) The full complement of 20 chromosome pairs. In the pair of images of chromosomes from a top3β−/− cell (Lower), one of the Cy5-painted autosome pairs is missing.
Figure 3
Figure 3
Localization of DNA topoisomerase IIIβ (Top3β) to meiotic chromosomes at pachytene. (ad) DAPI-stained chromosomes were painted with fluorescence-labeled secondary antibodies against antibodies that are specific to Cor1, Top3β, or a centromere-associated protein. (a) The axial elements and centromeres are highlighted in green. (b) Top3β is highlighted in red. (c) The images a and b were merged. (d) The merged images of a diplotene cell; little chromosome-associated Top3β signal was discernible in this and other diplotene cells. (eg) Magnified images of an XY pair. (e) The chromosome axes were marked by antibodies against Cor1, and the asynapsed and the synapsed pseudoautosomal region (PAR) of the XY pair are readily visible. In f and g, the latter being the merged images of e and f, antibodies specific to Top3β were seen to be prominently associated with the asynapsed portion of the XY pair. Cen, centromere. (h) When a longer exposure time was used in imaging, the merged images of the green anti-Cor1 stain and the red anti-Top3β stain revealed punctated red fluorescence foci along the axes of the autosomes. The bright red arc (in the 10 o'clock direction from the center of the micrograph) is the XY pair. In these experiments, mouse antibodies against Cor1, rabbit antibodies against Top3β, and human CREST sera that specifically stain the centromeres were used, and various fluorescence-labeled secondary antibodies were used to highlight the particular primary antibodies.
Figure 4
Figure 4
Relative time of appearance of Top3β and Rad51 on the XY pair during pachytene. (Upper) The chromosome axes were stained green, and both Top3β and Rad51 were stained red. (Lower) The chromosome axes were not stained, Top3β was stained red, and Rad51 was stained green. Staging of meiotic progression was based on the morphology of the Cor1-marked chromosome axes and the known time course of Rad51 appearance (23, 36). (Lower) Clear illustrations of the delayed appearance of the Top3β red fluorescence relative to that of the green Rad51 foci. The same conclusion can be drawn from Upper: whereas Top3β and Rad51 were both painted red, the former showed as patches along the chromosome axes and the latter showed as punctated foci.

References

    1. Wang J C. Annu Rev Biochem. 1996;65:635–692. - PubMed
    1. Champoux J J. Annu Rev Biochem. 2001;70:369–413. - PubMed
    1. Wang J C. Nat Rev Mol Cell Biol. 2002;3:430–440. - PubMed
    1. Zhu Q, Pongpech P, DiGate R J. Proc Natl Acad Sci USA. 2001;98:9766–9771. - PMC - PubMed
    1. Wallis J W, Chrebet G, Brodsky G, Rolfe M, Rothstein R. Cell. 1989;58:409–419. - PubMed

Publication types

MeSH terms