. 2003 Mar 4;100(5):2512-7.
doi: 10.1073/pnas.0437840100. Epub 2003 Feb 18.

Structure of a cholesterol-binding protein deficient in Niemann-Pick type C2 disease

Affiliations

Structure of a cholesterol-binding protein deficient in Niemann-Pick type C2 disease

Natalia Friedland et al. Proc Natl Acad Sci U S A. .

Abstract

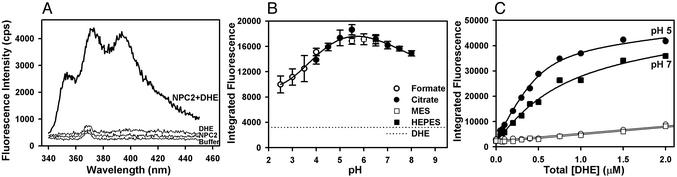
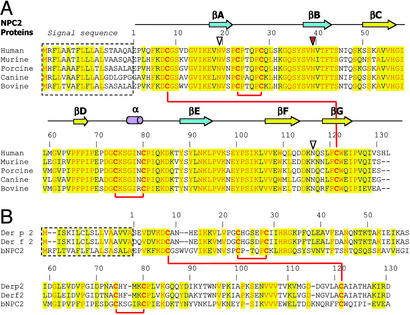
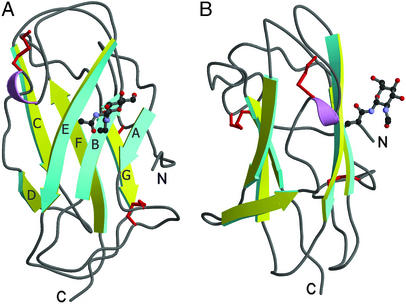
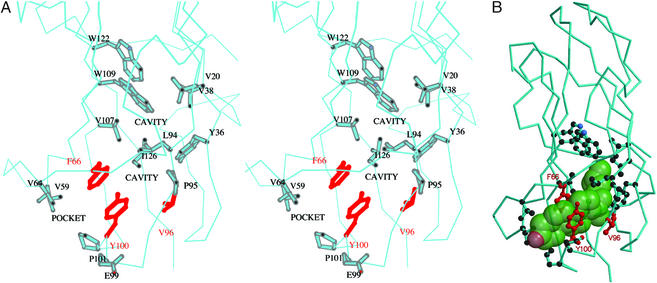
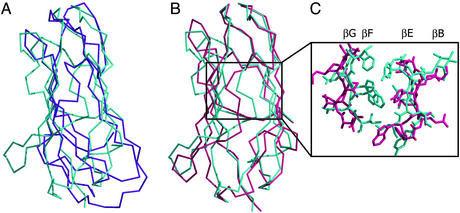
Niemann-Pick disease type C2 (NP-C2) is a fatal hereditary disease characterized by accumulation of low-density lipoprotein-derived cholesterol in lysosomes. Here we report the 1.7-A resolution crystal structure of the cholesterol-binding protein deficient in this disease, NPC2, and the characterization of its ligand binding properties. Human NPC2 binds the cholesterol analog dehydroergosterol with submicromolar affinity at both acidic and neutral pH. NPC2 has an Ig-like fold stabilized by three disulfide bonds. The structure of the bovine protein reveals a loosely packed region penetrating from the surface into the hydrophobic core that forms adjacent small cavities with a total volume of approximately 160 A(3). We propose that this region represents the incipient cholesterol-binding site that dilates to accommodate an approximately 740-A(3) cholesterol molecule.


Figures

Figure 1
Figure 1
Interaction of NPC2 with the fluorescent cholesterol analog DHE. (A) Fluorescence spectra. Samples contained buffer (20 mM citrate/150 mM NaCl, pH 5.0) with or without 10 μM hNPC2 and/or 1 μM DHE. The small emission peak at 368 nm in various controls represents Raman scattering of water. (B) pH dependence of NPC2–DHE fluorescent complex formation. Fluorescence data were obtained from DHE (0.25 μM) and hNPC2 (0.25 μM) in 150 mM NaCl buffered with 20 mM of the indicated buffer. Integrated fluorescence (λ 383–404 nm) data represent mean ± SEM of triplicate determinations. Background fluorescence of DHE alone (dotted line) was independent of pH and buffer composition. (C) Binding of DHE to NPC2 at pH 5 and 7. Fluorescence data were obtained with the indicated total concentrations of DHE in the absence or presence of 0.5 μM hNPC2 (open and filled symbols, respectively). Solutions contained either 150 mM NaCl and 20 mM citrate (pH 5.0) (circles) or 150 mM NaCl and 20 mM Hepes (pH 7.0) (squares). Dissociation constants were determined from curve fitting by using a nonlinear quadratic equation and a one-site occupancy model to take into account the fluorescence of bound and free ligand (16). The data shown yielded dissociation constants of 0.092 and 0.347 μM for pH 5 and 7, respectively. The individual dissociation constants obtained from four independent experiments ranged from 0.092 to 0.260 μM for pH 5 and 0.311 to 1.09 μM for pH 7.
Figure 2
Figure 2
Primary sequence alignments of NPC2 orthologs and related proteins. (A) Alignment of mammalian NPC2 proteins. Numbering starts with the first residue after the signal sequence. Conserved residues are highlighted in yellow, with identical residues printed in red. Secondary structure elements of the bNPC2 structure are shown above the primary sequence. Red lines connect cysteine residues that form disulfide bonds. Three potential glycosylation sites are marked by triangles with the absolutely conserved site, which is glycosylated in bNPC2, indicated in red. (B) Alignment of bNPC2 and dust mite allergen proteins Der p 2 and Der f 2. Numbering corresponds to bNPC2 with coloring as in A.
Figure 3
Figure 3
Structure of bNPC2. Ribbon diagrams of bNPC2 with views related by a 90° rotation. One β-sheet is shown in yellow and the other in cyan. The side chains of cysteine residues that form three disulfide bonds are shown in red. GlcNAc that modifies Asn-39 of strand βB is shown in ball-and-stick representation. This and all subsequent figures were generated by using molscript (17) and RASTER3D (18).
Figure 4
Figure 4
The predicted cholesterol binding site of bNPC2. (A) Stereo view of cavities within the loosely packed hydrophobic interior of bNPC2. A surface pocket and two small internal cavities (labeled) are thought to comprise an incipient cholesterol-binding site. Side chains of residues that line these cavities (described in the text) are shown in stick representation. The side chains of Phe-66, Val-96, and Tyr-100 that have been found to be essential for cholesterol binding (9) are shown in red. (B) The proposed binding site for cholesterol. A semitransparent space-filling model of cholesterol (green) has been manually docked in the proposed sterol-binding site. Note that, despite the complementarity of cholesterol to the length and shape of the cavity, the ligand cannot fit because of steric clashes with side chains that line the pocket. Presumably, the cavity must dilate to accommodate cholesterol. Side chains and coloring scheme are as indicated in A.
Figure 5
Figure 5
Comparison of bNPC2 and dust mite allergen Der p 2. (A) Difference in the overall shape of bNPC2 and the NMR structure of Der p 2. A superposition of the Cα trace of bNPC2 (cyan) and the structure of Der p 2 determined by NMR (magenta) reveals different molecular envelopes of the two proteins, despite topologically similar folds. (B) Superposition of bNPC2 and the x-ray structure of Der p 2. The Cα traces of bNPC2 (cyan) and the crystal structure of Der p 2 (pink) are superimposed with an rms deviation of 2.9 Å. The two proteins align well at the top but deviate in the positioning of their β-sheets, with the two sheets in Der p 2 spaced more widely than those in bNPC2. (C) Comparison of the β-sheet interfaces in the crystal structures of bNPC2 and Der p 2. Central portions of the β-sheets are shown as Cα traces with side chains shown in stick representation. The β-sheets of bNPC2 (cyan) are more closely spaced and contain more bulky side chains than those of Der p 2 (pink). This difference explains the presence of a large tunnel in the crystal structure of Der p 2 that is absent in bNPC2.

Similar articles

Cited by

References

    1. Goldstein J L, Hobbs H H, Brown M S. In: The Metabolic and Molecular Bases of Inherited Disease. Scriver C R, Beaudet A L, Sly W S, Valle D, editors. III. New York: McGraw–Hill; 2001. pp. 2863–2913.
    1. Patterson M C, Vanier M T, Suzuki K, Morris J A, Carstea E, Neufeld E B, Blanchette-Mackie J E, Pentchev P G. In: The Metabolic and Molecular Bases of Inherited Disease. Scriver C R, Beaudet A L, Sly W S, Valle D, editors. III. New York: McGraw–Hill; 2001. pp. 3611–3633.
    1. Carstea E D, Morris J A, Coleman K G, Loftus S K, Zhang D, Cummings C, Gu J, Rosenfeld M A, Pavan W J, Krizman D B, et al. Science. 1997;277:228–231. - PubMed
    1. Ioannou Y A. Nat Rev Mol Cell Biol. 2001;2:657–668. - PubMed
    1. Davies J P, Chen F W, Ioannou Y A. Science. 2000;290:2295–2298. - PubMed

Publication types

MeSH terms

Associated data