. 2003 Mar 4;100(5):2351-6.
doi: 10.1073/pnas.0436709100. Epub 2003 Feb 18.

Probing the kinesin reaction cycle with a 2D optical force clamp

Affiliations

Probing the kinesin reaction cycle with a 2D optical force clamp

Steven M Block et al. Proc Natl Acad Sci U S A. .

Abstract

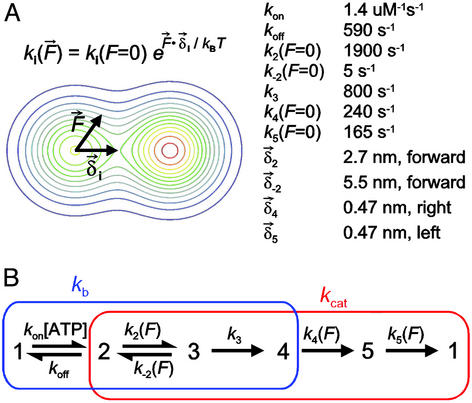
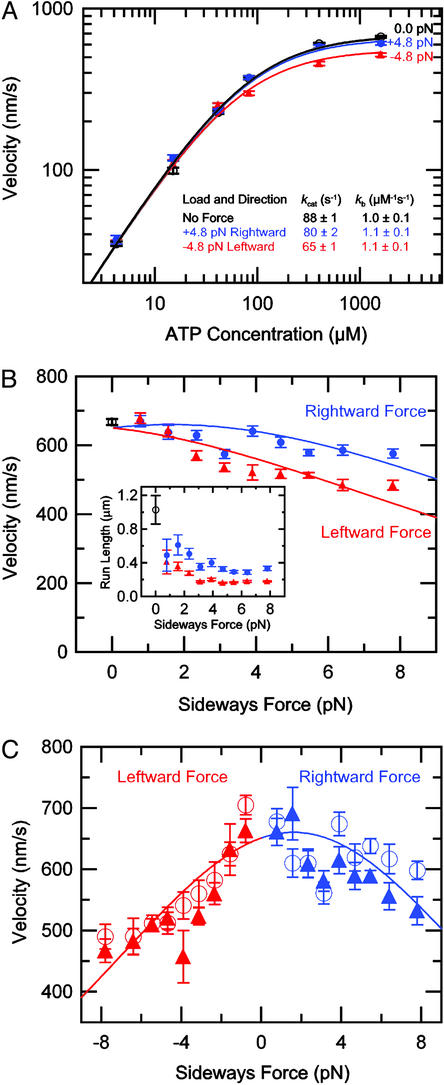
With every step it takes, the kinesin motor undergoes a mechanochemical reaction cycle that includes the hydrolysis of one ATP molecule, ADPP(i) release, plus an unknown number of additional transitions. Kinesin velocity depends on both the magnitude and the direction of the applied load. Using specialized apparatus, we subjected single kinesin molecules to forces in differing directions. Sideways and forward loads up to 8 pN exert only a weak effect, whereas comparable forces applied in the backward direction lead to stall. This strong directional bias suggests that the primary working stroke is closely aligned with the microtubule axis. Sideways loads slow the motor asymmetrically, but only at higher ATP levels, revealing the presence of additional, load-dependent transitions late in the cycle. Fluctuation analysis shows that the cycle contains at least four transitions, and confirms that hydrolysis remains tightly coupled to stepping. Together, our findings pose challenges for models of kinesin motion.


Figures

Figure 1
Figure 1
Operation of the 2D optical force clamp. (A) A cartoon illustrating the application of forces in two dimensions to single kinesin motors in our experimental geometry (not to scale). During an experiment, both the microscope stage (microtubule, red) and optical trap (orange) are moved dynamically to maintain constant force in two dimensions on the bead (blue), and thereby on the kinesin molecule (green) (7). A Cartesian sign convention based on the normal (plus-end directed) movement of native kinesin on the microtubule was adopted: forces applied forwards or to the right are considered positive, whereas forces applied rearwards or to the left are considered negative. (B) Sample x-y plot of experimental data for a run obtained under a constant rightward load of 4.8 pN. During the run, the bead and trap moved together, but laterally offset, from the bottom of the frame toward the top.
Figure 2
Figure 2
Model of the kinesin mechanochemical cycle. (A Left) A schematic diagram illustrating how force affects the transition rates involving motion. The application of load tilts the energy landscape (shown as a contour plot) along the direction of loading, changing the passage rate over the barrier according to the relation shown, where F⃗ ⋅ δ⃗i is the dot product of the force vector, F⃗, and the vector from the starting to the transition state, δ⃗i, pointing along the reaction coordinate. (A Right) Rate constants derived from a global fit of this reaction scheme to the data of Figs. 3 and 4 (see Materials and Methods). (B) A hypothetical five-state reaction scheme in which the transitions from 1→4 (blue rectangle) contribute to the MM parameter kb, whereas the transitions from 2→1 (red rectangle) contribute to kcat. The transition from 2↔3 involves a relatively large motion along the microtubule, whereas transitions from 4→5 and 5→1 involve smaller motions perpendicular to the microtubule that are equal in magnitude and opposite in direction.
Figure 3
Figure 3
The effect of sideways load on kinesin velocity. (A) Double-logarithmic plot of average bead velocity (mean ± SEM) vs. ATP concentration for different loading directions (black open circles, no force, n = 25–280; blue filled circles, 4.8 ± 0.1 pN rightward force, n = 29–99; red triangles, 4.8 ± 0.1 pN leftward force, n = 33–113). To derive the rate parameters, data were fit to the MM equation, V = (8.2 nm) ⋅ kcat[ATP]/([ATP] + kcat/kb). (B) Velocity (mean ± SEM) vs. applied sideways load at 1.6 mM ATP (black open circles, no force, n = 280; blue filled circles, rightward force, n = 87–142; red triangles, leftward force, n = 77–178). (Inset) Run length (mean ± SEM) vs. applied sideways load at 1.6 mM ATP (black open circle, no force, n = 56; blue filled circles, rightward force, n = 87–142; red triangles, leftward force, n = 77–178). (C) Velocity (mean ± SEM) vs. applied sideways load at 1.6 mM ATP for microtubules with their plus-ends pointing up (filled triangles, n = 29–105), or down (open circles, n = 35–81). Curves in AC represent the global fit to the five-state model of Fig. 2B (see Discussion).
Figure 4
Figure 4
The effect of longitudinal load on kinesin velocity and randomness. (A) Average bead velocity (mean ± SEM) vs. applied longitudinal load for fixed ATP concentrations (red triangles, right axis, 4.2 μM ATP, n = 44–115; blue circles, left axis, 1.6 mM ATP, n = 50–190). Video-tracked data under no external load are also displayed (black open triangles, 4.2 μM ATP, n = 280; open circles, 1.6 mM ATP, n = 58). (B) The Michaelis constant, KM, vs. applied load, calculated from the ratio of velocities shown in A (see Materials and Methods). (C) The randomness parameter, r (mean ± SEM), vs. longitudinal load for fixed ATP concentrations (red triangles, 4.2 μM ATP, n = 44–110; blue circles, 1.6 mM ATP, n = 50–165). Curves in A and C represent the global fit to the five-state model of Fig. 2B (see Discussion).

Similar articles

Cited by

References

    1. Schnitzer M J, Visscher K, Block S M. Nat Cell Biol. 2000;2:718–723. - PubMed
    1. deCastro M J, Fondecave R M, Clarke L A, Schmidt C F, Stewart R J. Nat Cell Biol. 2000;2:724–729. - PubMed
    1. Rice S, Lin A W, Safer D, Hart C L, Naber N, Carragher B O, Cain S M, Pechatnikova E, Wilson-Kubalek E M, Whittaker M, et al. Nature. 1999;402:778–784. - PubMed
    1. Svoboda K, Schmidt C F, Schnapp B J, Block S M. Nature. 1993;365:721–727. - PubMed
    1. Sindelar C V, Budny M J, Rice S, Naber N, Fletterick R, Cooke R. Nat Struct Biol. 2002;9:844–848. - PubMed

Publication types

LinkOut - more resources