

Structural basis by which alternative splicing confers specificity in fibroblast growth factor receptors
- PMID: 12591959
- PMCID: PMC151329
- DOI: 10.1073/pnas.0436500100
Structural basis by which alternative splicing confers specificity in fibroblast growth factor receptors
Abstract
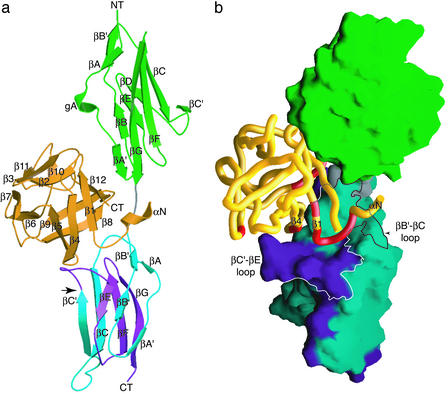
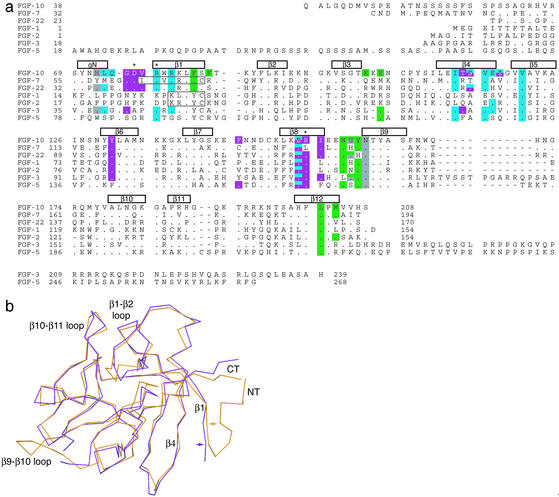
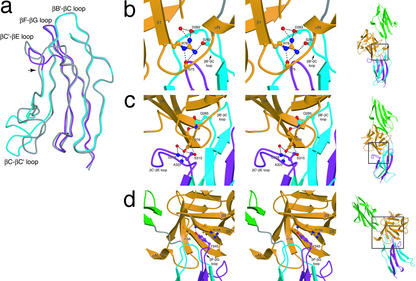
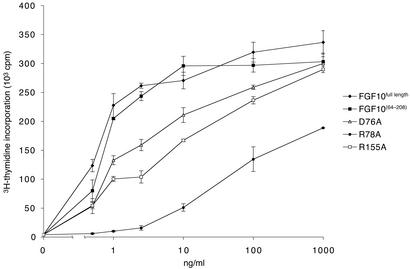
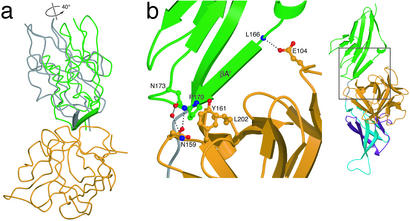
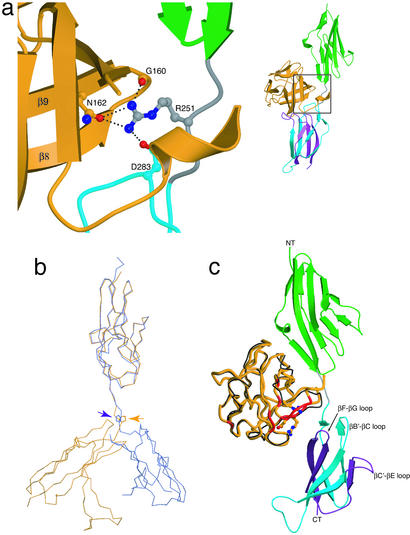
Binding specificity between fibroblast growth factors (FGFs) and their receptors (FGFRs) is essential for mammalian development and is regulated primarily by two alternatively spliced exons, IIIb ("b") and IIIc ("c"), that encode the second half of Ig-like domain 3 (D3) of FGFRs. FGF7 and FGF10 activate only the b isoform of FGFR2 (FGFR2b). Here, we report the crystal structure of the ligand-binding portion of FGFR2b bound to FGF10. Unique contacts between divergent regions in FGF10 and two b-specific loops in D3 reveal the structural basis by which alternative splicing provides FGF10-FGFR2b specificity. Structure-based mutagenesis of FGF10 confirms the importance of the observed contacts for FGF10 biological activity. Interestingly, FGF10 binding induces a previously unobserved rotation of receptor Ig domain 2 (D2) to introduce specific contacts with FGF10. Hence, both D2 and D3 of FGFR2b contribute to the exceptional specificity between FGF10 and FGFR2b. We propose that ligand-induced conformational change in FGFRs may also play an important role in determining specificity for other FGF-FGFR complexes.
Figures
Similar articles
-
Plasticity in interactions of fibroblast growth factor 1 (FGF1) N terminus with FGF receptors underlies promiscuity of FGF1.J Biol Chem. 2012 Jan 27;287(5):3067-78. doi: 10.1074/jbc.M111.275891. Epub 2011 Nov 4. J Biol Chem. 2012. PMID: 22057274 Free PMC article.
-
Identification of residues important both for primary receptor binding and specificity in fibroblast growth factor-7.J Biol Chem. 2000 Nov 10;275(45):34881-6. doi: 10.1074/jbc.M003293200. J Biol Chem. 2000. PMID: 10950949
-
Identification of receptor and heparin binding sites in fibroblast growth factor 4 by structure-based mutagenesis.Mol Cell Biol. 2001 Sep;21(17):5946-57. doi: 10.1128/MCB.21.17.5946-5957.2001. Mol Cell Biol. 2001. PMID: 11486033 Free PMC article.
-
Structural Biology of the FGF7 Subfamily.Front Genet. 2019 Feb 12;10:102. doi: 10.3389/fgene.2019.00102. eCollection 2019. Front Genet. 2019. PMID: 30809251 Free PMC article. Review.
-
Heparan sulfate fibroblast growth factor receptor complex: structure-function relationships.Mol Reprod Dev. 1994 Sep;39(1):69-81; discusison 81-2. doi: 10.1002/mrd.1080390112. Mol Reprod Dev. 1994. PMID: 7999363 Review.
Cited by
-
Exploring mechanisms of FGF signalling through the lens of structural biology.Nat Rev Mol Cell Biol. 2013 Mar;14(3):166-80. doi: 10.1038/nrm3528. Epub 2013 Feb 13. Nat Rev Mol Cell Biol. 2013. PMID: 23403721 Free PMC article. Review.
-
Influence of heparin mimetics on assembly of the FGF.FGFR4 signaling complex.J Biol Chem. 2010 Aug 20;285(34):26628-40. doi: 10.1074/jbc.M109.095109. Epub 2010 Jun 14. J Biol Chem. 2010. PMID: 20547770 Free PMC article.
-
Increased thermal stability of FGF10 leads to ectopic signaling during development.Cell Mol Life Sci. 2025 Apr 21;82(1):167. doi: 10.1007/s00018-025-05681-1. Cell Mol Life Sci. 2025. PMID: 40257501 Free PMC article.
-
Structural basis by which alternative splicing modulates the organizer activity of FGF8 in the brain.Genes Dev. 2006 Jan 15;20(2):185-98. doi: 10.1101/gad.1365406. Epub 2005 Dec 29. Genes Dev. 2006. PMID: 16384934 Free PMC article.
-
Fibroblast Growth Factor Receptors (FGFRs) and Noncanonical Partners in Cancer Signaling.Cells. 2021 May 14;10(5):1201. doi: 10.3390/cells10051201. Cells. 2021. PMID: 34068954 Free PMC article. Review.
References
-
- Martin G R. Genes Dev. 1998;12:1571–1586. - PubMed
-
- Johnson D E, Williams L T, Gritli-Linde A, Lewis P, McMahon A P, Linde A. Adv Cancer Res. 1993;60:1–41. - PubMed
-
- Rapraeger A C, Guimond S, Krufka A, Olwin B B. Methods Enzymol. 1994;245:219–240. - PubMed
-
- Yayon A, Klagsbrun M, Esko J D, Leder P, Ornitz D M. Cell. 1991;64:841–848. - PubMed
Publication types
MeSH terms
Substances
Associated data
- Actions
Grants and funding
LinkOut - more resources
Full Text Sources
Other Literature Sources
Molecular Biology Databases
Miscellaneous
