. 2003 Mar 4;100(5):2987-91.
doi: 10.1073/pnas.0437936100. Epub 2003 Feb 19.

Gravity-regulated differential auxin transport from columella to lateral root cap cells

Collaborators, Affiliations

Gravity-regulated differential auxin transport from columella to lateral root cap cells

Iris Ottenschläger et al. Proc Natl Acad Sci U S A. .

Abstract

Gravity-induced root curvature has long been considered to be regulated by differential distribution of the plant hormone auxin. However, the cells establishing these gradients, and the transport mechanisms involved, remain to be identified. Here, we describe a GFP-based auxin biosensor to monitor auxin during Arabidopsis root gravitropism at cellular resolution. We identify elevated auxin levels at the root apex in columella cells, the site of gravity perception, and an asymmetric auxin flux from these cells to the lateral root cap (LRC) and toward the elongation zone after gravistimulation. We differentiate between an efflux-dependent lateral auxin transport from columella to LRC cells, and an efflux- and influx-dependent basipetal transport from the LRC to the elongation zone. We further demonstrate that endogenous gravitropic auxin gradients develop even in the presence of an exogenous source of auxin. Live-cell auxin imaging provides unprecedented insights into gravity-regulated auxin flux at cellular resolution, and strongly suggests that this flux is a prerequisite for root gravitropism.


Figures

Figure 1
Figure 1
Changes in gravity vector orientation induce asymmetric expansion of DR5-GFPm signal in LRC cells. (A) Schematic representation of the Arabidopsis root apex (after refs. and 29). The color code labels different tissues (top to bottom: stele, pericycle, endodermis, cortex/endodermis initial, cortex, epidermis, pLRC, dLRC, QC, CI, and columella). (B) DR5-GFPm expression in QC, CI, and columella of vertically grown roots. (C) Faint GFPm signals appear in dLRC cells neighboring columellas S2 and S3 (indicated by arrows) in roots after 1.5 h of gravistimulation. (D) After 3 h of gravistimulation, the DR5-GFPm signal expands from columella to complete lower half of the LRC. (E) A 15-min gravistimulus is sufficient to induce DR5-GFPm signal expansion from columella to LRC cells. Note that the lower half of gravistimulated roots is at the right side (CE). (Bar = 20 μm.)
Figure 2
Figure 2
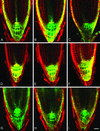
Effect of exogenous auxin application on vertically grown and gravistimulated roots. Auxin biosensor signal in roots grown on 1 μM IAA (AC), 1 μM 1-NAA (DF), 1 μM 2,4-D (GI) in vertically grown roots (A, D, and G), and after 5 h (B, E, and H) and 24 h (C, F, and I) of gravistimulation, respectively. Images are aligned with root tips to the vertical for better comparison. Note that lower half of gravistimulated roots is at the right side (B, C, E, F, H, and I). (Bar = 20 μm.)
Figure 3
Figure 3
Root curvature correlates with asymmetric auxin biosensor distribution. (A) Total curvature 5 and 20 h (black and gray bars, respectively) after gravistimulation at 135°. Kinetic measurements of root gravitropic curvature were done by using automated root image analysis software as described (11). Values represent means ± SE; n = 7–10 for all treatments. (B) DR5-GFPm signal asymmetry in LRC and epidermal cells of 1 μM 1-NAA-treated roots, gravistimulated for 24 h. (Bar = 20 μm.)
Figure 4
Figure 4
DR5-GFPm signal patterns induced by exogenous auxin application reflect differential auxin accumulation. In combination with either influx inhibitor 1-NOA or efflux inhibitor NPA, IAA-induced fluorescence patterns correspond to those induced by 1-NAA and 2,4-D, respectively (compare with Fig. 2). DR5-GFPm signals in roots grown on 1 μM IAA plus 50 μM 1-NOA (A), and 1 μM IAA plus 10 μM NPA (B), respectively. (Bar = 20 μm.)
Figure 5
Figure 5
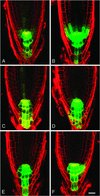
Effect of auxin transport inhibitor application on vertically grown and gravistimulated roots. Auxin biosensor signal in roots grown on 10 μM NPA (A and B), 20 μM BFA (C and D), and 50 μM 1-NOA (E and F) in vertically grown (B, C, and E) and 24-h gravistimulated (B, D, and F) roots. Images are aligned with root tips to the vertical for better comparison. Note that the lower half of gravistimulated roots is at the right side (B, D, and F). (Bar = 20 μm.)
Figure 6
Figure 6
Eir1-1 mutants have substantially elevated auxin levels in the root tip. (A) Free IAA levels of young seedling root tips determined by mass spectrometry. For each line, data were sampled from 10 measurements in two different experiments and are represented as means and SD. (B) Auxin biosensor signal reveals increased auxin levels in the pLRC of eir1-1 mutant root tip. (Bar = 20 μm.)

References

    1. Digby J, Firn R D. Plant Cell Environ. 1995;18:1434–1440. - PubMed
    1. Sack F D. Planta. 1997;203:S63–S68. - PubMed
    1. Firn R D, Wagstaff C, Digby J. J Exp Bot. 2000;51:1323–1340. - PubMed
    1. Muday G. J Plant Growth Regul. 2001;20:226–243. - PubMed
    1. Ishikawa H, Evans M L. Plant Physiol. 1995;109:725–727. - PMC - PubMed

Publication types