. 2003 Mar;71(3):1520-6.
doi: 10.1128/IAI.71.3.1520-1526.2003.

Effects of respiratory Mycoplasma pneumoniae infection on allergen-induced bronchial hyperresponsiveness and lung inflammation in mice

Affiliations

Effects of respiratory Mycoplasma pneumoniae infection on allergen-induced bronchial hyperresponsiveness and lung inflammation in mice

Hong Wei Chu et al. Infect Immun. 2003 Mar.

Abstract

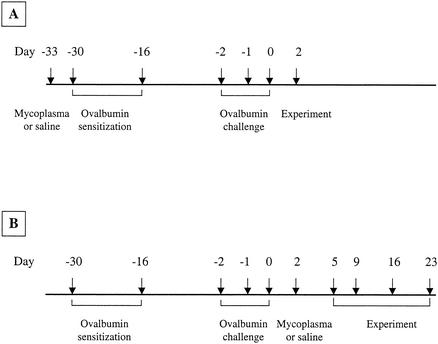
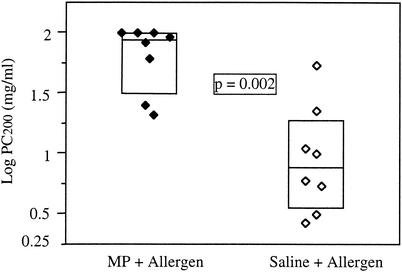
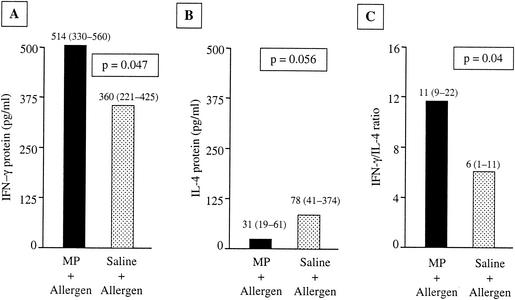
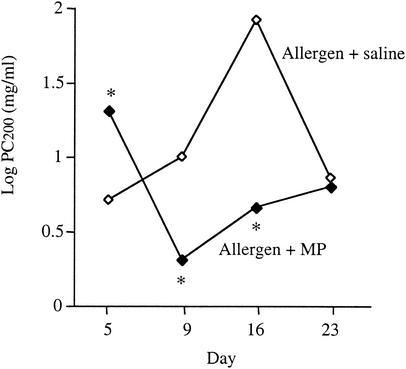
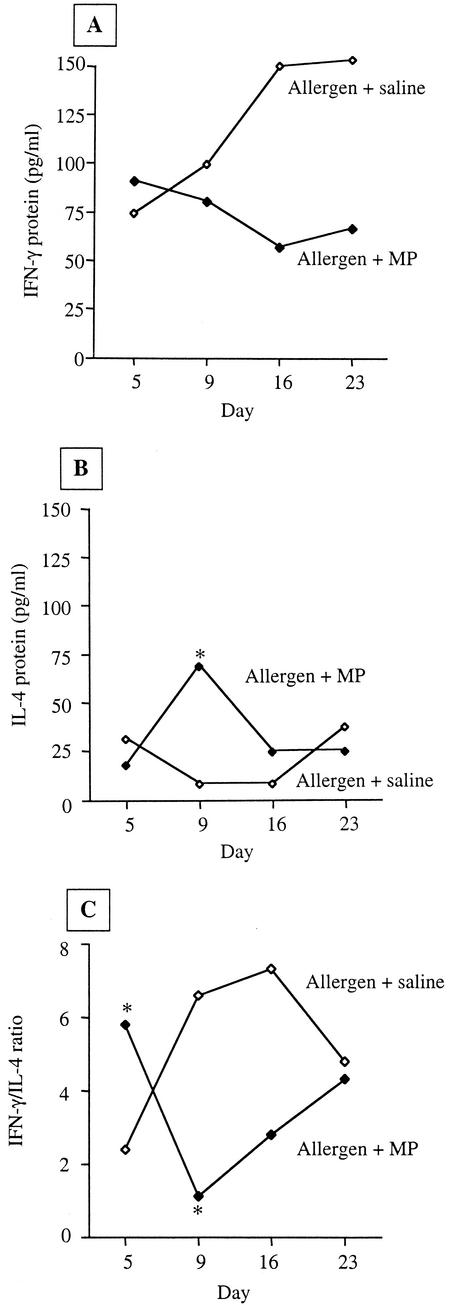
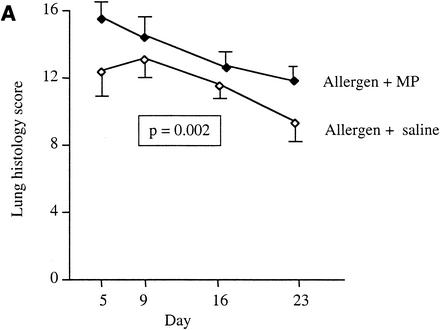
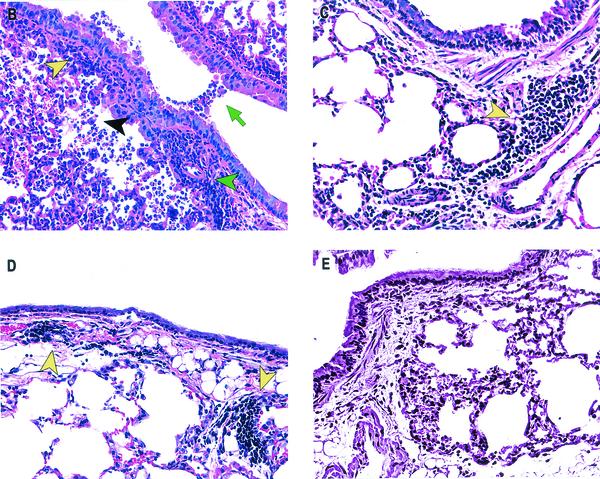
Airway mycoplasma infection may be associated with asthma pathophysiology. However, the direct effects of mycoplasma infection on asthma remain unknown. Using a murine allergic-asthma model, we evaluated the effects of different timing of airway Mycoplasma pneumoniae infection on bronchial hyperresponsiveness (BHR), lung inflammation, and the protein levels of Th1 (gamma interferon [IFN-gamma]) and Th2 (interleukin 4 [IL-4]) cytokines in bronchoalveolar lavage fluid. When mycoplasma infection occurred 3 days before allergen (ovalbumin) sensitization and challenge, the infection reduced the BHR and inflammatory-cell influx into the lung. This was accompanied by a significant induction of Th1 responses (increased IFN-gamma and decreased IL-4 production). Conversely, when mycoplasma infection occurred 2 days after allergen sensitization and challenge, the infection initially caused a temporary reduction of BHR and then increased BHR, lung inflammation, and IL-4 levels. Our data suggest that mycoplasma infection could modulate both physiological and immunological responses in the murine asthma model. Our animal models may also provide a new means to understand the role of infection in asthma pathogenesis and give evidence for the asthma hygiene hypothesis.


Figures

FIG. 1.
FIG. 1.
(A) Time line for M. pneumoniae infection followed by OVA sensitizations and challenges. (B) Time line for OVA sensitizations and challenges followed by M. pneumoniae infection.
FIG. 2.
FIG. 2.
Measurement of BHR to aerosolized-methacholine challenge in mice which were infected with M. pneumoniae (MP) or treated with saline followed by allergen (OVA) sensitizations and challenges as shown in Fig. 1A. Lower values of log PC200 represent greater BHR. The vertical boxes indicate 25th to 75th percentiles, and the horizontal lines in the boxes represent median values. n = 8 for MP + Allergen and Saline + Allergen groups.
FIG. 3.
FIG. 3.
Cytokine measurement in BAL fluid of mice which were infected with M. pneumoniae (MP) or treated with saline followed by allergen (OVA) sensitizations and challenges as shown in Fig. 1A. (A) IFN-γ protein level in BAL fluid. (B) IL-4 protein level in BAL fluid. (C) BAL fluid IFN-γ protein/IL-4 protein ratio. The data are expressed as medians with interquartile (25-to-75%) ranges. n = 8 for MP + Allergen and Saline + Allergen groups.
FIG. 4.
FIG. 4.
Measurement of BHR to aerosolized-methacholine challenge in mice which were sensitized and challenged with an allergen (OVA) followed by M. pneumoniae (MP) infection or saline treatment as shown in Fig. 1B. BHR measurement was performed on days 5, 9, 16, and 23 post-allergen challenge (days 3, 7, 14, and 21 postinfection) in Allergen + saline and Allergen + MP mice. Lower values of log PC200 represent greater BHR. The data are expressed as medians. n = 8, 6, 14, and 9 for allergen-challenged plus saline-treated mice on days 5, 9, 16, and 23 post-allergen challenge, respectively. n = 8, 8, 9, and 9 for allergen-challenged plus M. pneumoniae-infected mice on days 5, 9, 16, and 23 post-allergen challenge, respectively. *, P < 0.05 (allergen-challenged plus saline-treated versus allergen-challenged plus MP-infected mice).
FIG. 5.
FIG. 5.
Cytokine measurement in BAL fluid of mice which were sensitized and challenged with an allergen (OVA) followed by M. pneumoniae (MP) infection or saline treatment as shown in Fig. 1B. (A) IFN-γ protein level in BAL fluid. (B) IL-4 protein level in BAL fluid. (C) BAL fluid IFN-γ protein/IL-4 protein ratio. The data are expressed as medians. n = 8, 6, 14, and 9 for allergen-challenged plus saline-treated mice on days 5, 9, 16, and 23 post-allergen challenge, respectively. n = 8, 8, 9, and 9 for allergen-challenged plus MP-infected mice on days 5, 9, 16, and 23 post-allergen challenge, respectively. *, P < 0.05 (allergen-challenged plus saline-treated versus allergen-challenged plus MP-infected mice).
FIG. 6.
FIG. 6.
Lung histology of mice which were sensitized and challenged with an allergen (OVA) followed by M. pneumoniae (MP) infection or saline treatment as shown in Fig. 1B. (A) Lung histology scores (mean ± standard error of the mean) in allergen-challenged plus MP-infected mice were significantly higher than in allergen-challenged plus saline-treated mice. n = 8, 6, 14, and 9 for allergen-challenged plus saline-treated mice on days 5, 9, 16, and 23 post-allergen challenge, respectively. n = 8, 8, 9, and 9 for allergen-challenged plus MP-infected mice on days 5, 9, 16, and 23 post-allergen challenge, respectively. (B to E) Photomicrographs of lung tissue. (B) Mycoplasma-infected mouse lung on day 5 post-allergen challenge (day 3 postinfection) showing intensive inflammatory responses in the bronchiolar lumen (green arrow) and lung parenchyma (black arrowhead) and around a bronchiole (yellow arrowhead) and a blood vessel (green arrowhead). The main components of the inflammatory infiltrates are neutrophils, eosinophils, and mononuclear cells. (C) Saline-treated mouse lung on day 5 post-allergen challenge showing mild to moderate inflammatory infiltrate (mainly eosinophils and mononuclear cells) around a bronchiole and a blood vessel (yellow arrowhead). (D) Lung tissue from an infected mouse on day 23 post-allergen challenge (day 21 postinfection) showing peribronchiolar infiltrate of mononuclear cells (yellow arrowheads) and a few eosinophils. (E) Lung tissue from a saline-treated mouse on day 23 post-allergen challenge showing no obvious inflammatory infiltrate. (H&E staining; original magnification, ×200).
FIG. 6.
FIG. 6.
Lung histology of mice which were sensitized and challenged with an allergen (OVA) followed by M. pneumoniae (MP) infection or saline treatment as shown in Fig. 1B. (A) Lung histology scores (mean ± standard error of the mean) in allergen-challenged plus MP-infected mice were significantly higher than in allergen-challenged plus saline-treated mice. n = 8, 6, 14, and 9 for allergen-challenged plus saline-treated mice on days 5, 9, 16, and 23 post-allergen challenge, respectively. n = 8, 8, 9, and 9 for allergen-challenged plus MP-infected mice on days 5, 9, 16, and 23 post-allergen challenge, respectively. (B to E) Photomicrographs of lung tissue. (B) Mycoplasma-infected mouse lung on day 5 post-allergen challenge (day 3 postinfection) showing intensive inflammatory responses in the bronchiolar lumen (green arrow) and lung parenchyma (black arrowhead) and around a bronchiole (yellow arrowhead) and a blood vessel (green arrowhead). The main components of the inflammatory infiltrates are neutrophils, eosinophils, and mononuclear cells. (C) Saline-treated mouse lung on day 5 post-allergen challenge showing mild to moderate inflammatory infiltrate (mainly eosinophils and mononuclear cells) around a bronchiole and a blood vessel (yellow arrowhead). (D) Lung tissue from an infected mouse on day 23 post-allergen challenge (day 21 postinfection) showing peribronchiolar infiltrate of mononuclear cells (yellow arrowheads) and a few eosinophils. (E) Lung tissue from a saline-treated mouse on day 23 post-allergen challenge showing no obvious inflammatory infiltrate. (H&E staining; original magnification, ×200).

References

    1. Busse, W. W., and R. F. Lemanske, Jr. 2001. Asthma. N. Engl. J. Med. 344:350-356. - PubMed
    1. Chan, E. D., T. Kalayanamit, D. A. Lynch, R. Tuder, P. Arndt, R. Winn, and M. I. Schwarz. 1999. Mycoplasma pneumoniae-associated bronchiolitis causing severe restrictive lung disease in adults: report of three cases and literature review. Chest 115:1188-1194. - PMC - PubMed
    1. Cimolai, N., G. P. Taylor, D. Mah, and B. J. Morrison. 1992. Definition and application of a histopathological scoring scheme for an animal model of acute Mycoplasma pneumoniae pulmonary infection. Microbiol. Immunol. 36:465-478. - PubMed
    1. Cook, P. J., P. Davies, W. Tunnicliffe, J. G. Ayres, D. Honeybourne, and R. Wise. 1998. Chlamydia pneumoniae and asthma. Thorax 53:254-259. - PMC - PubMed
    1. Dorigo-Zetsma, J. W., R. P. Verkooyen, H. P. van Helden, H. van der Nat, and J. M. van den Bosch. 2001. Molecular detection of Mycoplasma pneumoniae in adults with community-acquired pneumonia requiring hospitalization. J. Clin. Microbiol. 39:1184-1186. - PMC - PubMed

Publication types