

Sequence-specific minor groove binding by bis-benzimidazoles: water molecules in ligand recognition
- PMID: 12595560
- PMCID: PMC149830
- DOI: 10.1093/nar/gkg237
Sequence-specific minor groove binding by bis-benzimidazoles: water molecules in ligand recognition
Abstract
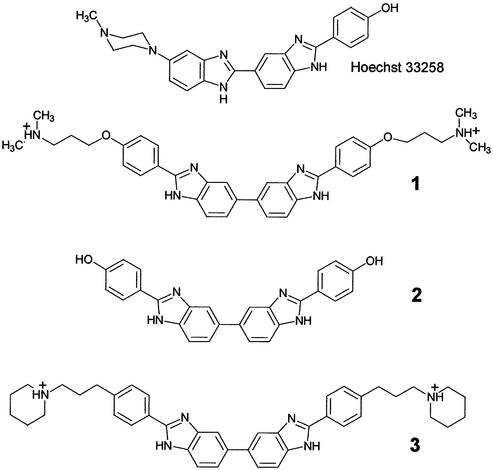
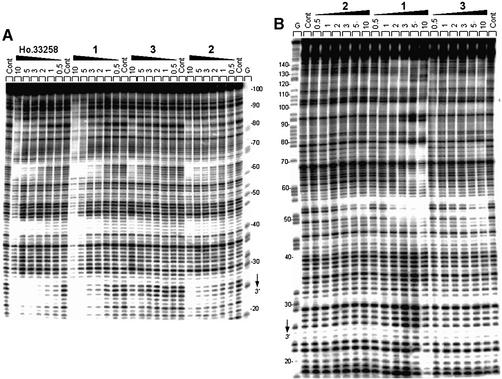
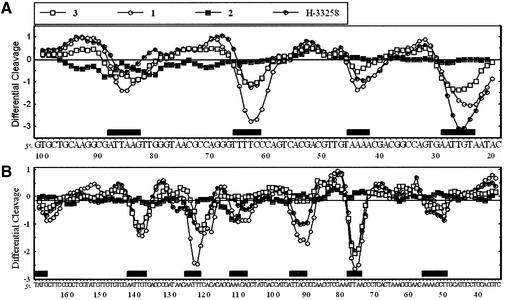
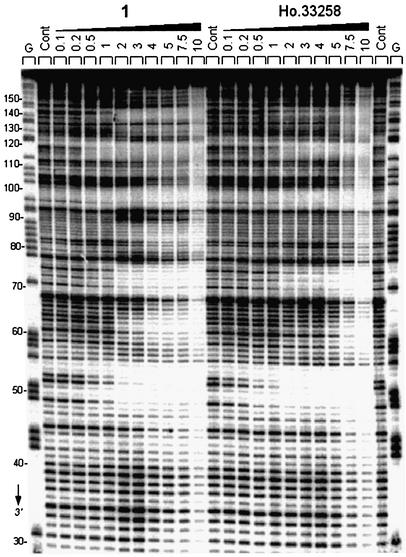
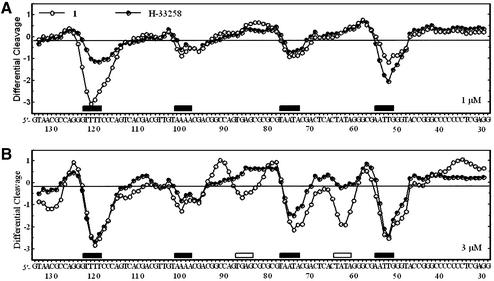
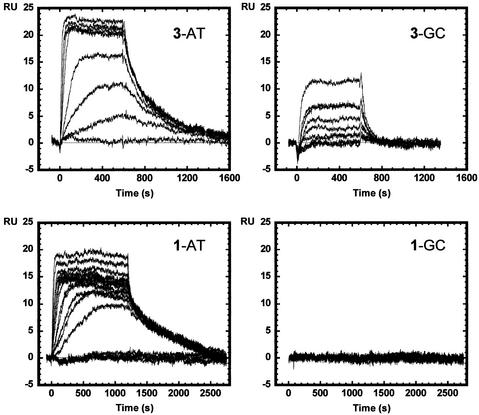
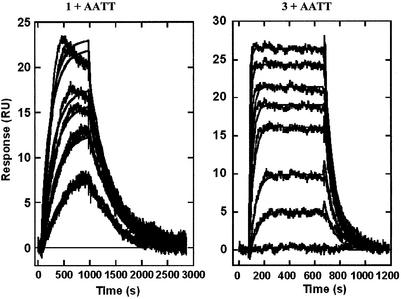
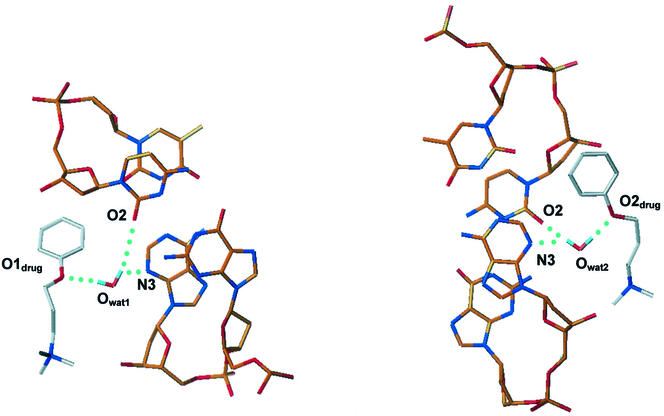
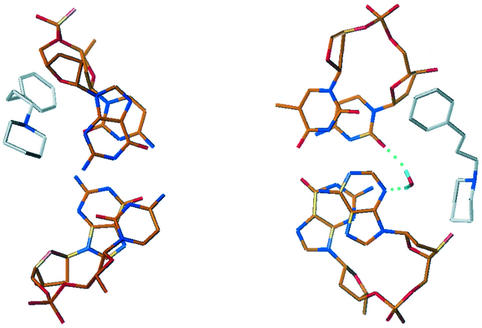
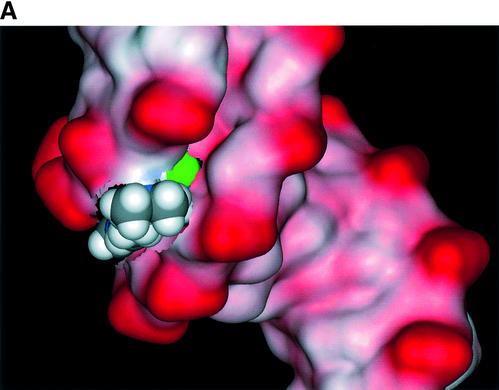
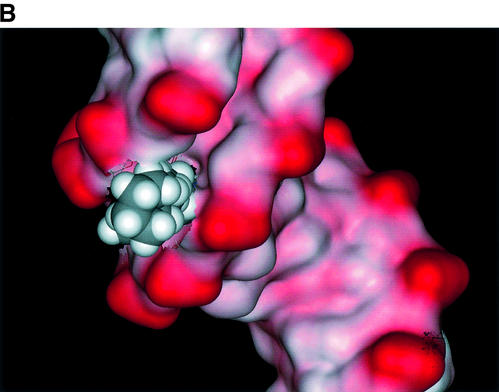
The binding of two symmetric bis-benzimidazole compounds, 2,2-bis-[4'-(3"-dimethylamino-1"-propyloxy)phenyl]-5,5-bi-1H-benzimidazole and its piperidinpropylphenyl analog, to the minor groove of DNA, have been studied by DNA footprinting, surface plasmon resonance (SPR) methods and molecular dynamics simulations in explicit solvent. The footprinting and SPR methods find that the former compound has enhanced affinity and selectivity for AT sequences in DNA. The molecular modeling studies have suggested that, due to the presence of the oxygen atom in each side chain of the former compound, a water molecule is immobilized and effectively bridges between side chain and DNA base edges via hydrogen bonding interactions. This additional contribution to ligand-DNA interactions would be expected to result in enhanced DNA affinity, as is observed.
Figures
Similar articles
-
Cooperative dimerization of a heterocyclic diamidine determines sequence-specific DNA recognition.Biochemistry. 2003 Nov 25;42(46):13576-86. doi: 10.1021/bi034852y. Biochemistry. 2003. PMID: 14622004
-
DNA sequence dependent monomer-dimer binding modulation of asymmetric benzimidazole derivatives.J Am Chem Soc. 2004 Jan 14;126(1):143-53. doi: 10.1021/ja030403+. J Am Chem Soc. 2004. PMID: 14709078
-
Water-mediated binding of agents that target the DNA minor groove.J Am Chem Soc. 2011 Jul 6;133(26):10171-83. doi: 10.1021/ja202006u. Epub 2011 Jun 15. J Am Chem Soc. 2011. PMID: 21627167 Free PMC article.
-
Footprinting: a method for determining the sequence selectivity, affinity and kinetics of DNA-binding ligands.Methods. 2007 Jun;42(2):128-40. doi: 10.1016/j.ymeth.2007.01.002. Methods. 2007. PMID: 17472895 Review.
-
Binding to the DNA minor groove by heterocyclic dications: from AT-specific monomers to GC recognition with dimers.Curr Protoc Nucleic Acid Chem. 2012 Dec;Chapter 8:Unit8.8. doi: 10.1002/0471142700.nc0808s51. Curr Protoc Nucleic Acid Chem. 2012. PMID: 23255206 Free PMC article. Review.
Cited by
-
Temperature and osmotic stress dependence of the thermodynamics for binding linker histone H10, Its carboxyl domain (H10-C) or globular domain (H10-G) to B-DNA.Biochem Biophys Rep. 2017 Oct 13;12:158-165. doi: 10.1016/j.bbrep.2017.09.009. eCollection 2017 Dec. Biochem Biophys Rep. 2017. PMID: 29090277 Free PMC article.
-
Break in the heat capacity change at 303 K for complex binding of netropsin to AATT containing hairpin DNA constructs.Biophys J. 2007 Apr 1;92(7):2516-22. doi: 10.1529/biophysj.106.098723. Epub 2007 Jan 19. Biophys J. 2007. PMID: 17237207 Free PMC article.
-
A high-throughput, high-resolution strategy for the study of site-selective DNA binding agents: analysis of a "highly twisted" benzimidazole-diamidine.J Am Chem Soc. 2006 Jun 21;128(24):7846-54. doi: 10.1021/ja0600936. J Am Chem Soc. 2006. PMID: 16771498 Free PMC article.
-
Molecular dynamics simulations and binding free energy analysis of DNA minor groove complexes of curcumin.J Mol Model. 2011 Nov;17(11):2805-16. doi: 10.1007/s00894-011-0954-2. Epub 2011 Feb 2. J Mol Model. 2011. PMID: 21287216
-
Spectroscopic, Viscositic, DNA Binding and Cytotoxic Studies of Newly Synthesized Steroidal Imidazolidines.J Fluoresc. 2016 Mar;26(2):639-49. doi: 10.1007/s10895-015-1750-7. Epub 2015 Dec 23. J Fluoresc. 2016. PMID: 26698876
References
-
- Bailly C. and Chaires,J.B. (1998) Design of sequence-specific DNA minor groove binders. Netropsin and distamycin analogues. Bioconjug. Chem., 9, 513–538. - PubMed
-
- Neidle S. (2001) DNA minor-groove recognition by small molecules. Natural Products Rep., 18, 291–309. - PubMed
-
- Dervan P.B. and Bürli, RW. (1999) Sequence-specific DNA recognition by polyamides. Curr. Opin. Chem. Biol., 3, 688–693 - PubMed
-
- Dervan P.B. (2001) Molecular recognition of DNA by small molecules. Bioorg. Med. Chem., 9, 2215–2235. - PubMed
-
- Gong B. and Yan,Y. (1997) New DNA minor-groove binding molecules with high sequence-selectivities and binding affinities. Biochem. Biophys. Res. Commun., 240, 557–560. - PubMed
Publication types
MeSH terms
Substances
Grants and funding
LinkOut - more resources
Full Text Sources
Miscellaneous
