

doi: 10.1086/346217.
2002 Curt Stern Award Address. Genomic disorders recombination-based disease resulting from genomic architecture
Affiliations
- PMID: 12596790
- PMCID: PMC379220
- DOI: 10.1086/346217
Item in Clipboard
2002 Curt Stern Award Address. Genomic disorders recombination-based disease resulting from genomic architecture
Am J Hum Genet.
2003 Feb.
No abstract available
Figures

James R. Lupski
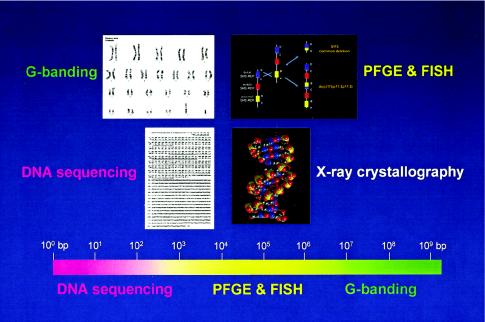
Genome architecture and methods to resolve structure of varying DNA sizes. Above are shown four levels of genome architecture, from viewing the entire human genome, resolved by conventional G-banding, to the molecular double helical structure of DNA, revealed by x-ray crystallography. The focus of the Human Genome Project has been to determine the primary DNA sequence information. Below is shown a scale of the human genome from 1 bp (100 bp) to 3×10⁹ bp and the size ranges (color coded) in which the different methods can physically resolve differences. Note that the genome architecture in the size range of ∼3×10⁴ to 4×10⁶ bp cannot be resolved either by DNA sequencing and agarose gel electrophoresis or by conventional G-banding. The techniques of PFGE and FISH extended the range of genetic technologies, enabling resolution of DNA rearrangements in the size range of >30 kb to <4 Mb. DNA rearrangements responsible for genomic disorders are often within the size range resolved only by PFGE and/or FISH.
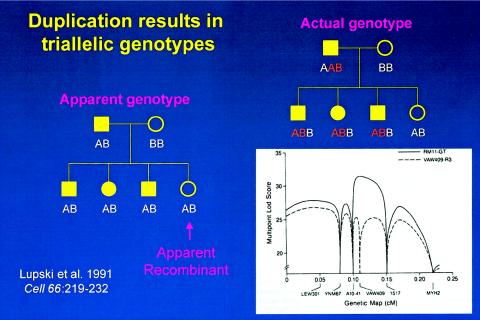
The effects of molecular duplication on the interpretation of marker genotypes and linkage mapping. Standard pedigree symbols are used: females depicted by circles and males by squares. Filled-in symbols denote affected individuals. On the left is a simple pedigree with marker genotypes scored as a usual biallelic system with one of the two alleles inherited from each parent. One unaffected daughter is an apparent recombinant, since she has the same apparent genotype as her three affected siblings. To the right is shown the actual genotypes scored as a triallelic system, accounting for the molecular duplication. The lower right shows how the different scoring biallelic (dashed line) versus triallelic (bold line) affects the multipoint LOD score. Note the differences in peak LOD scores and the fact that the failure to account for three alleles (or dosage differences in heterozygous RFLPs) results in an erroneous map position.
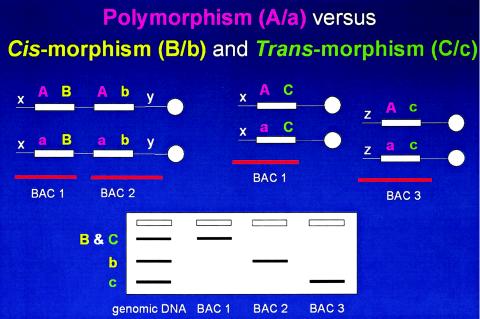
Paralagous sequence variations (PSVs). Above are depicted homologous chromosomes (thin horizontal lines), with centromeres (white circles) to the right. LCR sequences (white rectangles) are shown with sequence variations depicted as colored letters. The white x, y, and z denote unique flanking sequences in the genome used to anchor BAC clones (horizontal red lines). Below is shown a hypothetical Southern analysis with lanes containing genomic DNA and DNA from BAC clones. Cis-morphisms refer to paralogous sequence variations on the same chromosome B/b (yellow). Trans-morphisms (C/c) refer to PSVs on different chromosomes. Both cis-morphisms and trans-morphisms are revealed by BAC-specific cross-hybridizing restriction endonuclease fragment bands when using an LCR-specific probe. These PSVs are distinguished from polymorphisms (A/a; purple), the latter referring to allelic variation of the same sequence on different chromosome homologues. It is not clear what percentage of SNPs are actually paralogous sequence variants. Nor is it immediately obvious how the lack of recognition of this distinction (i.e., SNP vs. PSV) may effect the interpretation of mapping and other genetic studies. Potentially, the lack of this distinction in mapping studies could have one or more of three effects (since the PSVs can be several megabases apart or even on different chromosomes): erroneous map position, loss of linkage, or false positive linkage.
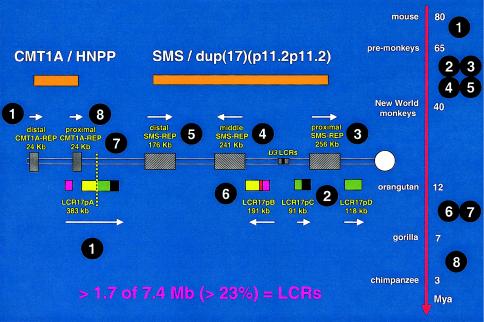
Evolution of proximal 17p LCR during primate speciation. Proximal chromosome 17p is depicted by two thin horizontal lines with the centromere (white circle) shown to the right. LCRs are shown as horizontal rectangles with the same color or black-and-white graphic, representing highly homologous (identity usually >97%) sequence. Above are shown the genomic segments (orange), either duplicated in CMT1A and dup(17)(p11.2p11.2) or deleted in HNPP and SMS, respectively. To the right is shown a time line of mammalian, mainly primate, speciation, with the millions of years (Mya) as indicated. The white numbers circled in black indicate the approximate time at which the segmental duplication occurred and the given LCR appeared. The depicted sequence of events represents a working model that most parsimoniously explains present experimental observations. Note that one of the oldest LCRs, LCR17pA (1), was split by the most recent segmental duplication (8) that resulted in the proximal CMT1A-REP, which is present in humans and chimpanzees. Likewise, the proximal SMS-REP (3) has split a more ancient LCR (2) into LCR17pC and LCR17pD. The present orientation of middle SMS-REP and LCR17pB in the human genome may result from an inversion event after a directly oriented copy of middle SMS-REP appeared during primate speciation through a segmental duplication of proximal SMS-REP (6). The vertical dotted yellow line demarcates the evolutionary chromosome translocation 4;19 in Gorilla gorilla (7). Incredibly, LCRs represent >23% of the 7.4-Mb genomic sequence analyzed in proximal 17p. The majority of these LCRs have been found at the breakpoint of at least one DNA rearrangement.
References
-
- Bailey JA, Gu Z, Clark RA, Reinert K, Samonte RV, Schwartz S, Adams MD, Myers EW, Li PW, Eichler EE (2002) Recent segmental duplications in the human genome. Science 297:1003–1007 - PubMed
-
- Bi W, Yan J, Stankiewicz P, Park S-S, Walz K, Boerkoel CF, Potocki L, Shaffer LG, Devriendt K, Nowaczyk MJM, Inoue K, Lupski JR (2002) Genes in a refined Smith-Magenis syndrome critical deletion interval on chromosome 17p11.2 and the syntenic region of the mouse. Genome Res 12:713–728 - PMC - PubMed
-
- Boerkoel CF, Inoue K, Reiter LT, Warner LE, Lupski JR (1999) Molecular mechanisms for CMT1A duplication and HNPP deletion. Ann NY Acad Sci 883:22–35 - PubMed
-
- Cann HM, de Toma C, Cazes L, Legrand M-F, Morel V, Piouffre L, Bodmer J, Bodmer WF, Bonne-Tamir B, Cambon-Thomsen A, Chen Z, Chu J, Carcassi C, Contu L, Du R, Excoffier L, Ferrara GB, Friedlaender JS, Groot H, Gurwitz D, Jenkins T, Herrera RJ, Huang X, Kidd J, Kidd KK, Langaney A, Lin AA, Mehdi SQ, Parham P, Piazza A, Pistillo MP, Qian Y, Shu Q, Xu J, Zhu S, Weber JL, Greely HT, Feldman MW, Thomas G, Dausset J, Cavalli-Sforza LL (2002) A human genome diversity cell line panel. Science 296:261–262 - PubMed
-
- Chance PF, Abbas N, Lensch MW, Pentao L, Roa BB, Patel PI, Lupski JR (1994) Two autosomal dominant neuropathies result from reciprocal DNA duplication/deletion of a region on chromosome 17. Hum Mol Genet 3:223–228 - PubMed
Publication types
MeSH terms
LinkOut - more resources
Full Text Sources
Medical
