. 2003 Mar;162(3):861-71.
doi: 10.1016/S0002-9440(10)63882-5.

Expression of B-lymphocyte-associated transcription factors in human T-cell neoplasms

Affiliations

Expression of B-lymphocyte-associated transcription factors in human T-cell neoplasms

Teresa Marafioti et al. Am J Pathol. 2003 Mar.

Abstract

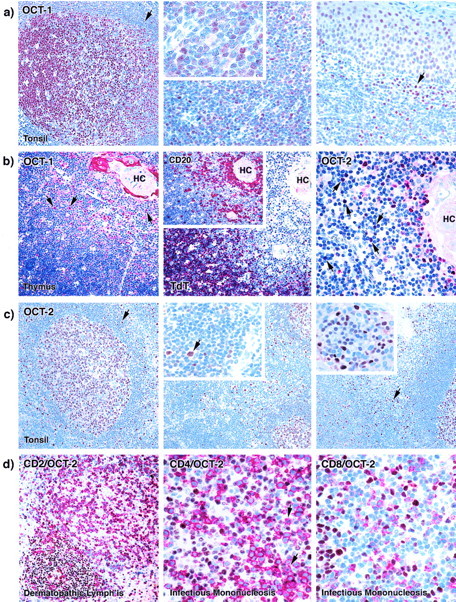
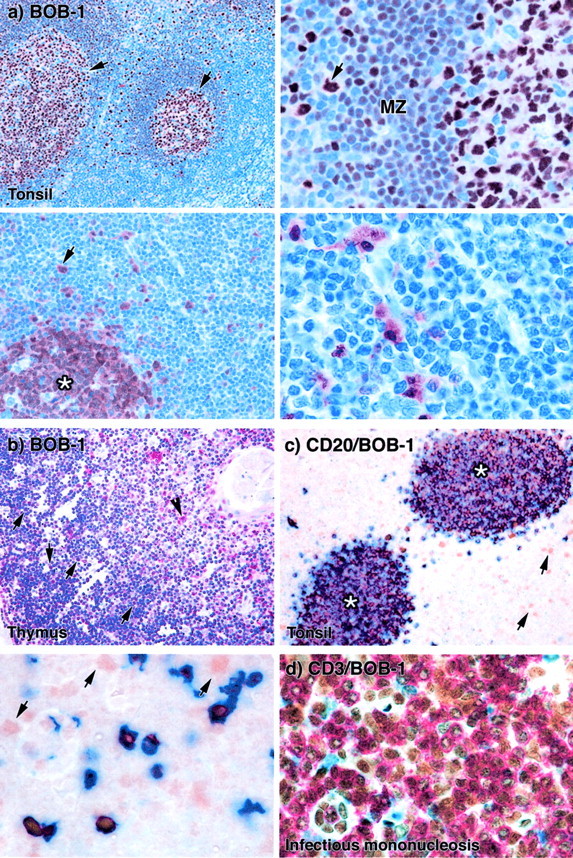
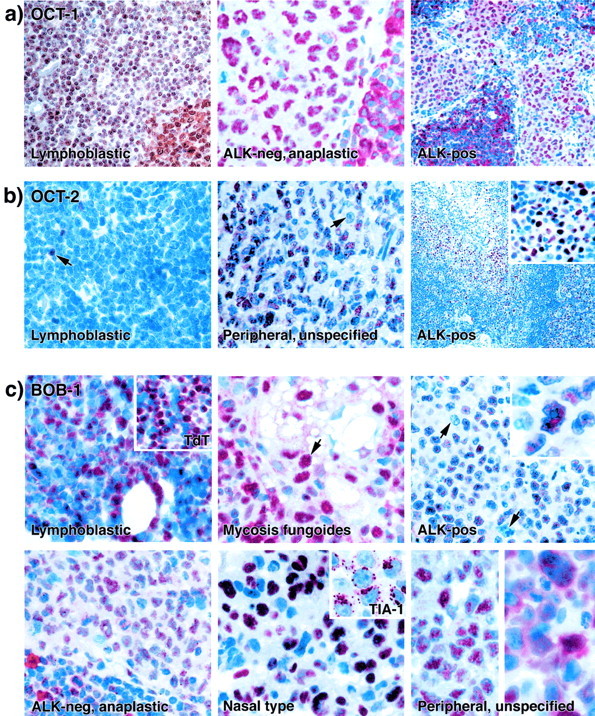
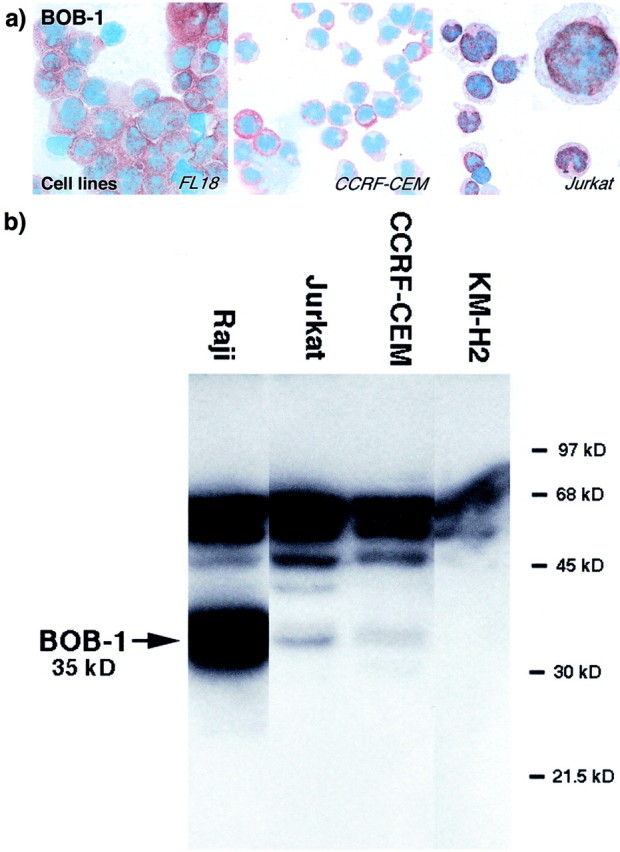
In this study we have investigated the expression of three B-cell-associated transcription factors in normal lymphoid tissue and in T-cell neoplasms (three cell lines, and more than 50 biopsy samples). Nuclear OCT-1 immunoreactivity was seen in normal B cells, in many extrafollicular T cells, and in a heterogeneous pattern (ranging in intensity from weak to moderate) in most T-cell neoplasms. OCT-2 immunostaining was primarily restricted in normal lymphoid tissue to B cells, and was absent from most T-cell neoplasms. In contrast, immunostaining for BOB-1/OCA-B--essentially restricted to B cells in normal lymphoid tissue, with the exception of activated T-lymphocytes--was seen in all of the T-cell lines tested and the majority of the tumor cells in all categories of T-cell lymphoma. Thus labeling for each of these three B-cell-associated transcription factors can be seen to varying degrees in T-cell neoplasms. However, the high frequency of BOB-1 expression in T-cell neoplasms, in contrast to its absence from resting peripheral T cells, suggests that its expression might be a prerequisite for neoplastic transformation, and prompts a search for the transcriptional target(s) of this factor in T cells.


Figures

Figure 1.
Figure 1.
Single and double immunostaining by OCT-1 and OCT-2 antibodies on paraffin-embedded human tonsil, thymus, and reactive lymph nodes. a: Left: Nuclear OCT-1 staining is seen in germinal center cells. Lymphocytes in the mantle zone (arrow) show negative to weak labeling. Middle: The majority of the lymphocytes in the interfollicular (T cell-rich) area show nuclear OCT-1 staining (see inset). Right: Plasma cells (arrows) and overlying tonsillar squamous epithelial cells also show nuclear staining. b: Left: Weak nuclear OCT-1 staining was observed in cortical thymocytes that were TdT-positive (middle). In the medulla OCT-1 was seen in B lymphocytes (arrows) that express CD20 (center, inset). OCT-1 staining was also found in the cytoplasm of epithelial cells forming the Hassall’s corpuscles (HCs). Right: OCT-2 antibody stained in the thymus mainly B cells (arrows), and a few scattered cortical and medullary thymocytes. c: Left: OCT-2 nuclear labeling is seen in a germinal center. The mantle zone (arrows) is also weakly labeled. Middle: In the interfollicular area of hyperplastic tonsil only scattered cells (arrows in inset) are OCT-2-positive. Right: Plasma cells (arrow) lying under the tonsillar crypt epithelium show moderate to strong OCT-2 positivity (see inset). d: Left: Double-immunoenzymatic staining for CD2 (red) and OCT-2 (brown) in a case of dermatopathic lymphadenitis shows scattered CD2-positive, OCT-2-positive T cells. Center: Double-immunoenzymatic staining for CD4 (red) and OCT-2 (brown) in a case of infectious mononucleosis. Only a few activated CD4-positive (red) T cells express OCT-2 (brown) (arrows). Right: Double-immunoenzymatic staining for CD8 (red) and OCT-2 (brown) of the same cases of infectious mononucleosis double immunolabeled for CD4 and OCT-2. CD8-positive (red) T cells turned out to be OCT-2-negative (brown).
Figure 2.
Figure 2.
Single and double immunostaining by BOB-1 antibody on paraffin-embedded human tonsil, thymus, and reactive lymph nodes. a: BOB-1 immunostaining in paraffin sections of human tonsil. Top left: Cells in germinal centers (arrows) are strongly labeled. Top right: A higher power view shows that most cells in the follicle mantle zone (MZ) are BOB-1-positive. The arrow indicates a strongly BOB-1-positive peri-mantle large cell. Bottom left: A low-power view of an interfollicular area and part of a B-cell follicle (asterisk) shows that only a few cells outside the follicle are positive (arrow). Bottom right: A higher power view shows clearly that most cells in the interfollicular area are BOB-1-negative. b: In thymus BOB-1 antibody labeled strongly B cells lying in the medulla (arrowhead) and weakly scattered cortical thymocytes (arrows). c: Double-immunoenzymatic staining for CD20 (blue) and BOB-1 (brown) in paraffin sections of human tonsil. Top right: The low-power view shows two lymphoid follicles (asterisks) and scattered interfollicular BOB-1-positive CD20-negative lymphocytes (arrows) that are presumably T cells. Bottom left: A higher magnification view shows these cells more clearly (arrows). (Note that in some of the B cells the intense blue label for CD20 obscures the underlying brown reaction product for BOB-1.) d: Double-immunoenzymatic staining for CD3 (red) and BOB-1 (brown) in a case of infectious mononucleosis. Numerous CD3-positive T cells co-express BOB-1.
Figure 3.
Figure 3.
Immunostaining by anti-OCT-1, anti-OCT-2, and anti-BOB-1 antibodies on paraffin-embedded T-cell neoplasms. a: OCT-1 immunostaining. Nuclear OCT-1 staining is seen in a T-lymphoblastic lymphoma (left) (note the residual germinal center in the bottom right corner of this image), in an ALK-negative anaplastic large T-cell lymphoma (center), and in an ALK-positive anaplastic large T-cell lymphoma (right) (note a residual B-cell area in the bottom left quadrant of the latter image). b: OCT-2 immunolabeling. Left: In a T-lymphoblastic lymphoma, the only positive cells are rare residual B cells (arrows). Center: In a case of peripheral T-cell lymphoma, NOS, >50% of the neoplastic cells stain for OCT-2 (an OCT-2-negative lymphoma cell is arrowed). Right: An ALK-positive anaplastic large T-cell lymphoma cell infiltrating lymph node sinuses expresses OCT-2 (seen also at higher magnification in the inset). c: BOB-1 immunostaining. Top left: In a case of T-lymphoblastic lymphoma neoplastic cells stain strongly for BOB-1 (the inset shows the TdT positivity of the tumor). Top center: A case of mycosis fungoides shows BOB-1 labeling in the tumor cells (arrow) infiltrating a sebaceous gland. Top right: In an ALK-positive lymphoma many cells express BOB-1 in the nucleus (seen at higher magnification in the inset), but the arrows indicate BOB-1-negative tumor cells. Bottom left: An ALK-negative anaplastic large T-cell lymphoma shows moderate nuclear BOB-1 staining. Bottom center: In a peripheral T/NK cell lymphoma of nasal-type strong BOB-1 nuclear positivity is seen in the lymphoma cells (which also express the TIA-1 molecule, see inset). Bottom right: The two images show the two patterns of BOB-1 staining seen in T-cell lymphomas: either restricted to nuclei (left), or present in both nuclei and cytoplasm (right).
Figure 4.
Figure 4.
Immunohistochemical and biochemical studies of transformed cell lines by anti-BOB-1 antibody. a: Cell lines labeled for BOB-1. Left: Strong nuclear and cytoplasmic BOB-1 staining is seen in a follicle center lymphoma-derived B-cell line (FL18). The T-lymphoblastic-derived T-cell line (CCRF-CEM) shows cytoplasmic BOB-1 staining, and cytoplasmic and nuclear BOB-1 labeling is seen in the Jurkat T-cell line (see also inset at higher magnification). b: Western blotting of cell lysates from Raji (B cell), Jurkat (T cell), CCRF-CEM (T cell), and KMH2 (Hodgkin’s disease) cell lines. The widely studied anti-BOB-1-antibody from Santa Cruz detects a protein with the expected molecular weight for BOB-1 (35 kd) in cell lysates of the Raji, Jurkat, and CCRF-CEM cell lines. The latter cell line shows a weaker additional band of ∼33 kd. Cell lysates of the Hodgkin’s-derived KMH2 cell line revealed only the presence of the higher band (60 kd) common to the other three cell lines and show the absence of the 35-kd proteins.
Figure 5.
Figure 5.
Two possible hypotheses to account for BOB-1 expression in T-cell neoplasms are sketched in this diagram.

Similar articles

Cited by

References

    1. Henderson A, Calame K: Transcriptional regulation during B cell development. Annu Rev Immunol 1998, 16:163-200 - PubMed
    1. Kuo CT, Leiden JM: Transcriptional regulation of T lymphocyte development and function. Annu Rev Immunol 1999, 17:149-187 - PubMed
    1. Wirth T, Pfisterer P, Annweiler A, Zwilling S, Konig H: Molecular principles of Oct2-mediated gene activation in B cells. Immunobiology 1995, 193:161-170 - PubMed
    1. Shah PC, Bertolino E, Singh H: Using altered specificity Oct-1 and Oct-2 mutants to analyze the regulation of immunoglobulin gene transcription. EMBO J 1997, 16:7105-7117 - PMC - PubMed
    1. Matthias P: Lymphoid-specific transcription mediated by the conserved octamer site: who is doing what? Semin Immunol 1998, 10:155-163 - PubMed

Publication types

LinkOut - more resources