. 2003 Mar;162(3):907-23.
doi: 10.1016/S0002-9440(10)63886-2.

Expression of protease-activated receptor-1, -2, -3, and -4 in control and experimentally inflamed mouse bladder

Affiliations

Expression of protease-activated receptor-1, -2, -3, and -4 in control and experimentally inflamed mouse bladder

Michael R D'Andrea et al. Am J Pathol. 2003 Mar.

Abstract

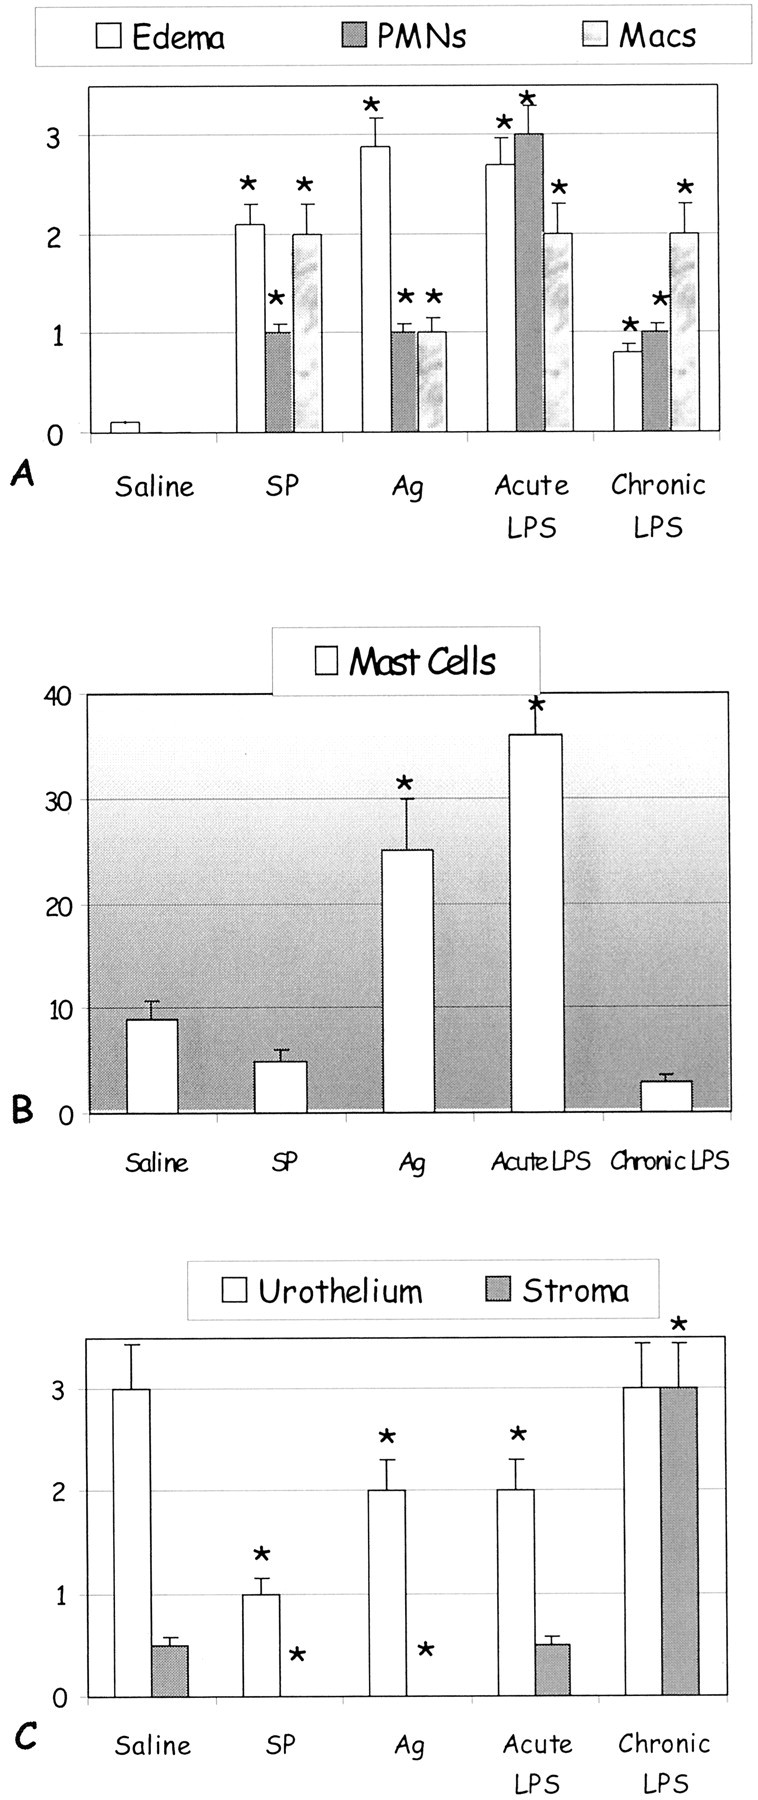
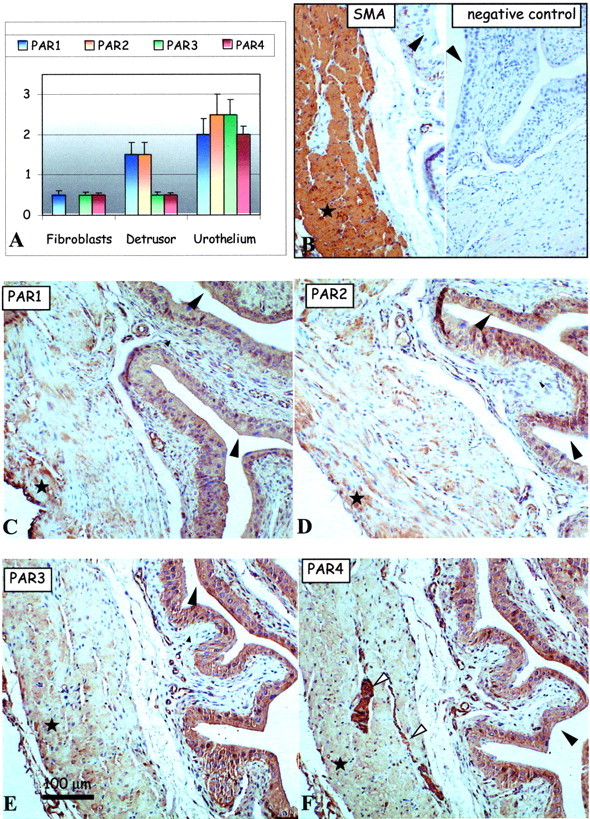
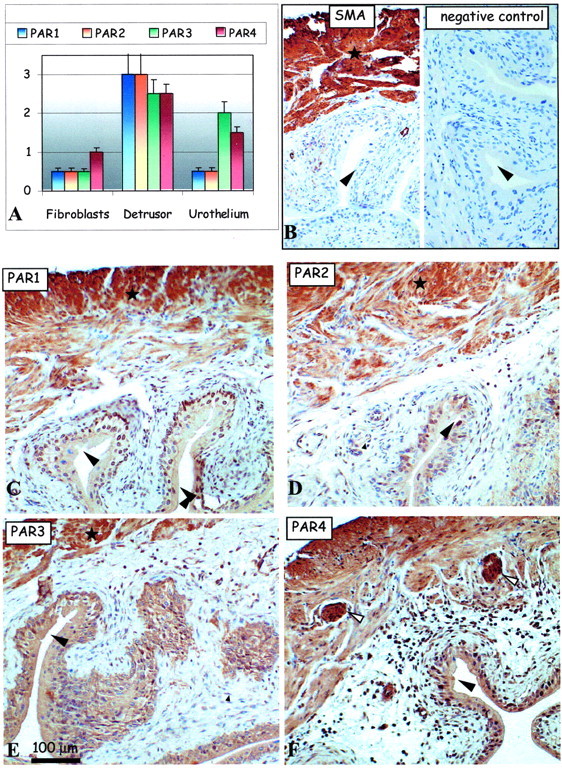
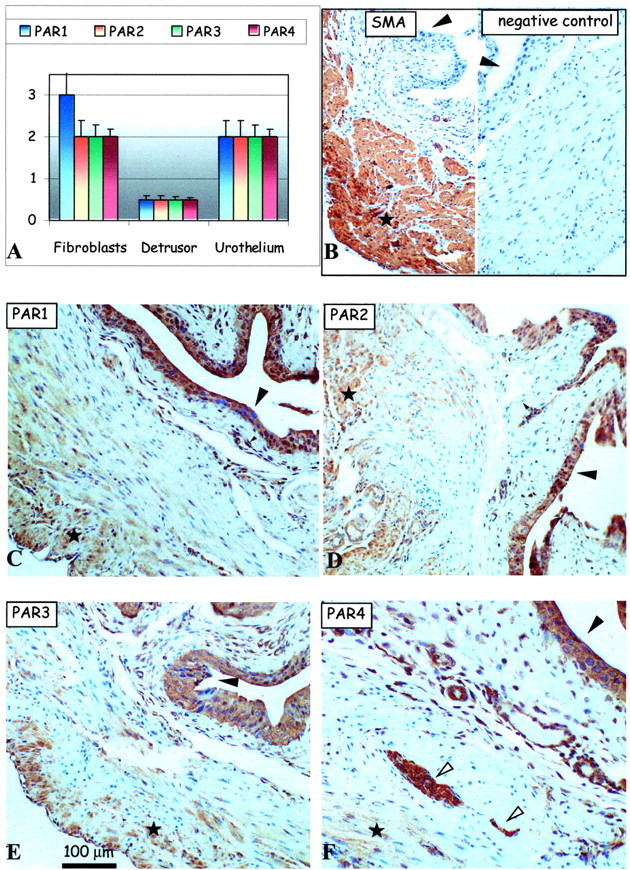
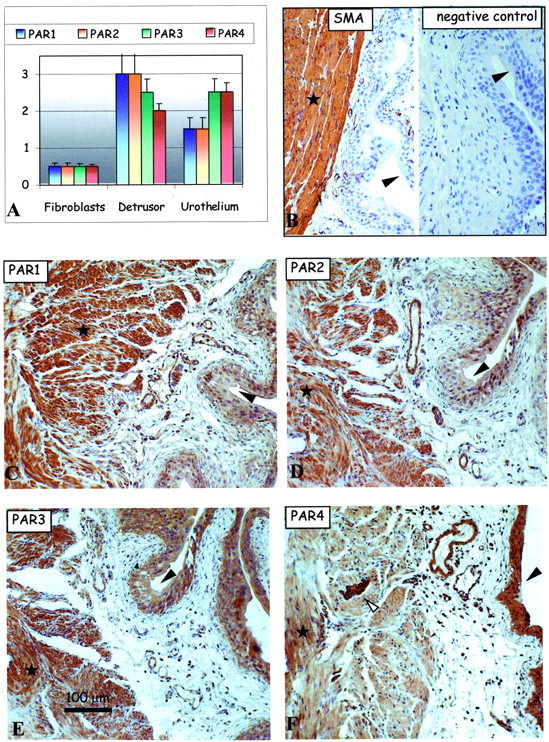
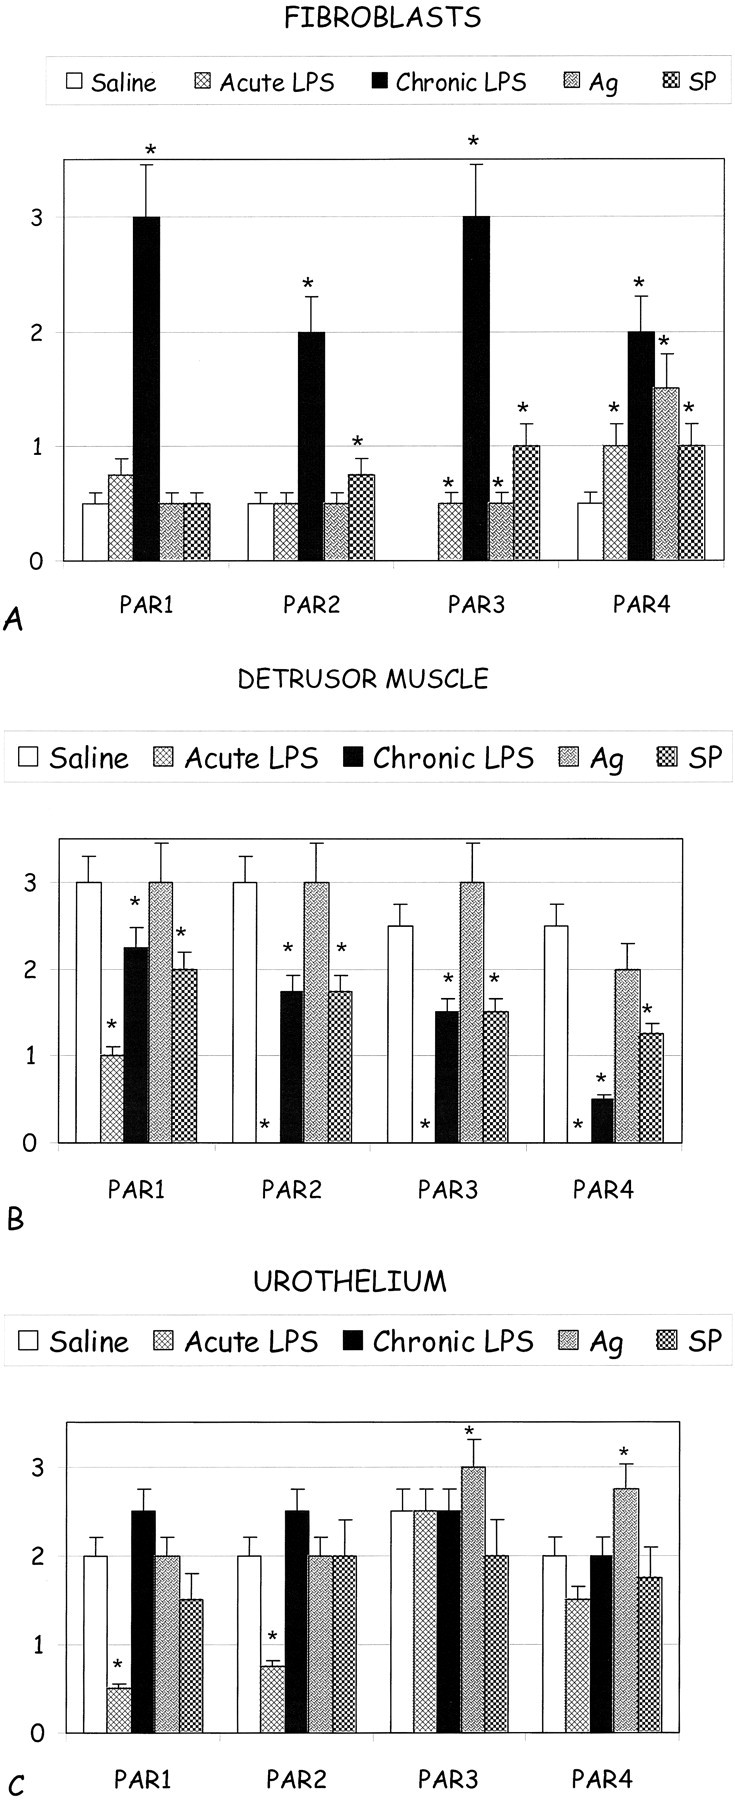
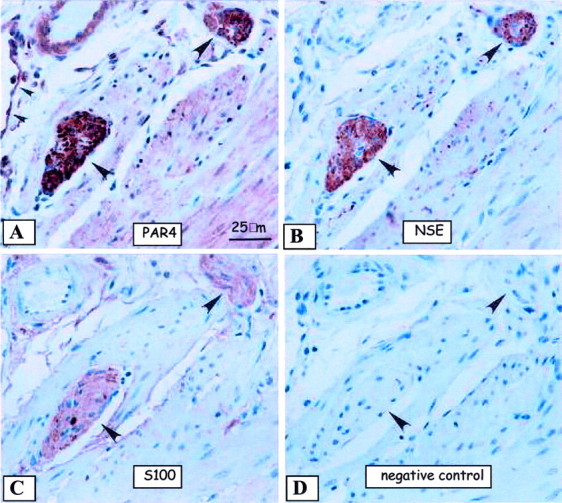
Inflammation underlines all major bladder pathologies and represents a defense reaction to injury involving a mandatory participation of mast cells and sensory nerves. Mast cells are particularly frequent in close proximity to epithelial surfaces where they are strategically located in the bladder and release their mediators in response to inflammation. Tryptase is specifically produced by mast cells and modulates inflammation by activating protease-activated receptors (PARs). We recently found that PAR-4 mRNA is up-regulated in experimental bladder inflammation regardless of the initiating stimulus. Because it has been reported that PAR-1, PAR-2, and PAR-3 may also be involved in the processes of inflammation, we used immunohistochemistry to characterize the expression of all known PARs in normal, acute, and chronic inflamed mouse bladder. We found that all four PARs are present in the control mouse bladder, and follow a unique distribution. All four PARs are co-expressed in the urothelium, whereas PAR-1 and PAR-2 are predominant in the detrusor muscle, and PAR-4 is expressed in peripheral nerves and plexus cell bodies. The strong expression of PARs in the detrusor muscle indicates the need for studies on the role of these receptors in motility whereas the presence of PAR-4 in nerves may indicate its participation in neurogenic inflammation. In addition, PARs are differentially modulated during inflammation. PAR-1 and PAR-2 are down-regulated in acute inflammation whereas PAR-3 and PAR-4 are up-regulated. Bladder fibroblasts were found to present a clear demarcation in PAR expression secondary to acute and chronic inflammation. Our findings provide evidence of participation of PARs in the urinary system, provide a working model for mast cell tryptase signaling in the mouse bladder, and evoke testable hypotheses regarding the roles of PARs in bladder inflammation. It is timely to understand the role of tryptase signaling and PARs in the context of bladder biology.


Figures

Figure 1.
Figure 1.
Quantification of inflammation induced by LPS (acute and chronic)-, Ag-, and SP-challenged conditions. Acute inflammation was induced by single stimulation with SP, Ag (in sensitized mice), or LPS. Chronic LPS inflammation was provoked by repeated bladder instillation with LPS every 24 hours throughout a 4-day period. Control mice were instilled with saline. Tissues were removed 24 hours after the last instillation. A semiquantitative score using defined criteria of inflammation severity was used to evaluate edema formation as follows: 1+, mild (little or no interstitial edema); 2+, moderate interstitial edema; 3+, severe interstitial edema (A). A: IHC was used for detection of PMNs (anti-myeloperoxidase) and macrophages (anti-MAC-3). B: Mast cells were counted per cross-section of Luna’s toluidine blue. C: The effect of inflammation on urothelial and stromal cell proliferation was determined by PCNA immunolabeling. Results are the average and SEM of six experiments. Asterisks indicate a statistical significant difference (P < 0.05) from bladders treated with saline.
Figure 2.
Figure 2.
PAR expression in the urinary bladder of saline-treated mice. A: Bar charts show average intensities of immunolabeling for PAR-1 (blue), PAR-2, PAR-3, and PAR-4 in the mouse bladder tissues. B–F: Representative immunohistochemical micrographs show detection of positive control SMA (B, left) and the lack of any immunolabeling using the negative control antibody (B, right) in consecutive sections of mouse bladder tissue. Remaining representative images show immunolabeling patterns for the detection of PAR-1 (C), PAR-2 (D), PAR-3 (E), and PAR-4 (F) expression in serial mouse bladder sections. Large arrowheads identify the urothelium, small arrowheads identify the fibroblasts of the lamina propria in the subepithelial region of the bladder, white arrows identify nerve fibers, and asterisks show areas of the detrusor muscle. Original magnifications, ×150.
Figure 3.
Figure 3.
Effect of acute LPS treatment on PAR expression in the mouse urinary bladder. A: Bar charts show average intensities of immunolabeling for PAR-1 (blue), PAR-2, PAR-3, and PAR-4 in the mouse bladder tissues. B–F: Representative immunohistochemical micrographs show detection of positive control SMA (B, left) and the lack of any immunolabeling using the negative control antibody (B, right) in consecutive sections of mouse bladder tissue. Remaining representative images show immunolabeling patterns for the detection of PAR-1 (C), PAR-2 (D), PAR-3 (E), and PAR-4 (F) expression in serial mouse bladder sections. Large arrowheads identify the urothelium, small arrowheads identify the fibroblasts of the lamina propria in the subepithelial region of the bladder, white arrows identify nerve fibers, and asterisks show areas of the detrusor muscle. Original magnifications, ×150.
Figure 4.
Figure 4.
Effect of chronic LPS treatment on PAR expression in the mouse urinary bladder. A: Bar charts show average intensities of immunolabeling for PAR-1 (blue), PAR-2, PAR-3, and PAR-4 in the mouse bladder tissues. B–F: Representative immunohistochemical micrographs show detection of positive control SMA (B, left) and the lack of any immunolabeling using the negative control antibody (B, right) in consecutive sections of mouse bladder tissue. Remaining representative images show immunolabeling patterns for the detection of PAR-1 (C), PAR-2 (D), PAR-3 (E), and PAR-4 (F) expression in serial mouse bladder sections. Large arrowheads identify the urothelium, small arrowheads identify the fibroblasts of the lamina propria in the subepithelial region of the bladder, white arrows identify nerve fibers, and asterisks show areas of the detrusor muscle. Original magnifications, ×150.
Figure 5.
Figure 5.
Effect of acute Ag treatment on PAR expression in the sensitized mouse urinary bladder. A: Bar charts show average intensities of immunolabeling for PAR-1 (blue), PAR-2, PAR-3, and PAR-4 in the mouse bladder tissues. B–F: Representative immunohistochemical micrographs show detection of positive control SMA (B, left) and the lack of any immunolabeling using the negative control antibody (B, right) in consecutive sections of mouse bladder tissue. Remaining representative images show immunolabeling patterns for the detection of PAR-1 (C), PAR-2 (D), PAR-3 (E), and PAR-4 (F) expression in serial mouse bladder sections. Large arrowheads identify the urothelium, small arrowheads identify the fibroblasts of the lamina propria in the subepithelial region of the bladder, white arrows identify nerve fibers, and asterisks show areas of the detrusor muscle. Original magnifications, ×150.
Figure 6.
Figure 6.
Effect of acute SP treatment on PAR expression in the mouse urinary bladder. A: Bar charts show average intensities of immunolabeling for PAR-1 (blue), PAR-2, PAR-3, and PAR-4 in the mouse bladder tissues. B–F: Representative immunohistochemical micrographs show detection of positive control SMA (B, left) and the lack of any immunolabeling using the negative control antibody (B, right) in consecutive sections of mouse bladder tissue. Remaining representative images show immunolabeling patterns for the detection of PAR-1 (C), PAR-2 (D), PAR-3 (E), and PAR-4 (F) expression in serial mouse bladder sections. Large arrowheads identify the urothelium, small arrowheads identify the fibroblasts of the lamina propria in the subepithelial region of the bladder, white arrows identify nerve fibers, and asterisks show areas of the detrusor muscle. Original magnifications, ×150.
Figure 7.
Figure 7.
Bar graphs showing comparative PAR-immunolabeling patterns in the various conditions (saline control, acute LPS, chronic LPS, Ag-challenged, SP-challenged) in the fibroblasts of the lamina propria in the subepithelium (A) and in the detrusor muscle (B) and urothelial (C) cells. Asterisks indicate a statistical significant difference (P < 0.05) from bladders treated with saline.
Figure 8.
Figure 8.
Representative images (serial sections) of an enlarged region of the detrusor muscle show the lack of remarkable PAR-1 (A), PAR-2 (B), and PAR-3 (C) immunolabeling in the same area with prominent PAR-4 (D) immunolabeling of the nerve fibers (arrowheads). For control, lack of immunolabeling is observed using the α-SMA (E) and negative control (F) antibodies in the identical areas of the nerve fibers (arrowheads). Additional representative images of consistently intense PAR-4 immunolabeling in the nerve bundles and plexus cell bodies (arrowheads) are presented in the mouse bladder throughout the detrusor muscle layer (G), which did not vary in the acute LPS (left), chronic LPS (middle), and Ag-challenged (right) inflammation conditions. Original magnifications: ×600 (A–F); ×300 (G).
Figure 9.
Figure 9.
Representative immunohistochemical images to detect neuronal elements of serially sectioned mouse bladder are presented. A: Presence of PAR-4 appears to be in peripheral nerve bundles (large arrowheads). Note the nearby PAR-4-positive endothelium (small arrowheads). B: Presence of neuronal-specific enolase-positive peripheral nerve fibers (large arrowheads) of the same serially sectioned PAR-4-positive (A) fibers confirms the presence of PAR-4 in peripheral nerve. C: The same PAR-4-, neuronal-specific enolase-positive peripheral nerve fibers do not share the same labeling patterns as S100 (large arrowheads). D: The lack of primary antibody shows the lack of any detectable immunolabeling in the same serially sectioned nerve fibers. Original magnifications, ×600.

Similar articles

Cited by

References

    1. Okragly A, Niles A, Saban R, Schmidt D, Hoffman R, Warner T, Moon T, Uehling D, Haak-Frendscho M: Elevated tryptase, NGF, NT-3, and GDNF levels in the urine of interstitial cystitis and bladder cancer patients. J Urol 1999, 161:434-441 - PubMed
    1. Saban M, Nguyen N-B, Hammond T, Saban R: Gene expression profiling of mouse bladder inflammatory responses to LPS, substance P, and antigen-stimulation. Am J Pathol 2002, 160:2095-2110 - PMC - PubMed
    1. Hollenberg D, Compton S: International Union of Pharmacology. XXVIII. Proteinase-Activated Receptors. Pharmacol Rev 2002, 54:203-217 - PubMed
    1. Vergnolle N, Wallace JL, Bunnett NW, Hollenberg MD: Protease-activated receptors in inflammation, neuronal signaling and pain. Trends Pharmacol Sci 2001, 22:146-152 - PubMed
    1. Vergnolle N: Proteinase-activated receptors—novel signals for gastrointestinal pathophysiology. Aliment Pharmacol Ther 2000, 14:257-266 - PubMed

Publication types