Structural and functional changes in heparan sulfate proteoglycan expression associated with the myofibroblastic phenotype
- PMID: 12598330
- PMCID: PMC3278775
- DOI: 10.1016/S0002-9440(10)63892-8
Structural and functional changes in heparan sulfate proteoglycan expression associated with the myofibroblastic phenotype
Abstract
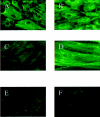
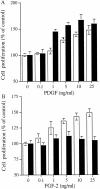
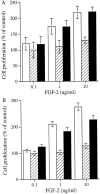
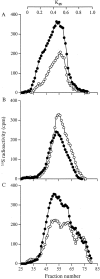
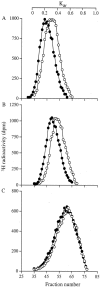
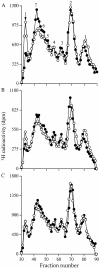
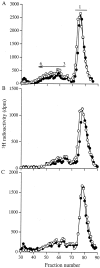
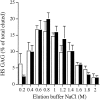
The principal cells implicated as the source of the extracellular matrix in areas of progressive fibrosis are fibroblasts with the phenotypic appearance of myofibroblasts. This report describes differences in heparan sulfate proteoglycan expression between myofibroblasts and normal fibroblasts, associated with impaired responses to fibroblast growth factor-2 (FGF-2). Although both cell types responded to platelet-derived growth factor, myofibroblasts, unlike fibroblasts, did not proliferate to FGF-2. A response was acquired, however, when myofibroblasts were incubated with FGF-2 in the presence of heparan sulfate (HS) and heparin. Selective digestion with pronase, NaOH/NaBH(4), heparinase I, or low pH nitrous acid showed that each HS-glycosaminoglycan region comprised a pronase-resistant peptide separating two HS chains. The HS-glycosaminoglycan chains from myofibroblasts were larger (K(av), 0.32; molecular weight, 50 kd) than those from fibroblasts (K(av), 0.4; molecular weight, 33 kd), although their disaccharide composition was identical. The chains from myofibroblasts, however, contained three, compared to two, heparinase 1-resistant sequences separated by larger contiguous areas of low sulfation. Furthermore, although there was no difference in FGF-2-binding affinity between the two cell types, the chains secreted by myofibroblasts had twice the binding capacity of those from fibroblasts. Thus, it is likely that the difference in response to FGF-2 is because of a difference in FGF-2 sequestration and receptor interaction with FGF-2-HS complexes. A comparative investigation into HS fine structure is being undertaken to examine these findings in more detail.
Figures
Similar articles
-
In vitro changes in plasma membrane heparan sulfate proteoglycans and in perlecan expression participate in the regulation of fibroblast growth factor 2 mitogenic activity.J Cell Physiol. 1996 Jan;166(1):170-87. doi: 10.1002/(SICI)1097-4652(199601)166:1<170::AID-JCP19>3.0.CO;2-J. J Cell Physiol. 1996. PMID: 8557766
-
Heparan sulfate proteoglycans function as receptors for fibroblast growth factor-2 activation of extracellular signal-regulated kinases 1 and 2.Circ Res. 2004 Feb 20;94(3):316-23. doi: 10.1161/01.RES.0000112965.70691.AC. Epub 2003 Dec 18. Circ Res. 2004. PMID: 14684627
-
Cell surface heparan sulfate proteoglycans control the response of renal interstitial fibroblasts to fibroblast growth factor-2.Kidney Int. 2001 Jun;59(6):2084-94. doi: 10.1046/j.1523-1755.2001.00723.x. Kidney Int. 2001. PMID: 11380810
-
Fibroblast growth factor-2.Int J Biochem Cell Biol. 2000 Mar;32(3):263-7. doi: 10.1016/s1357-2725(99)00133-8. Int J Biochem Cell Biol. 2000. PMID: 10716624 Review.
-
Myofibroblasts: molecular crossdressers.Curr Top Dev Biol. 2001;51:91-107. doi: 10.1016/s0070-2153(01)51003-0. Curr Top Dev Biol. 2001. PMID: 11236717 Review.
Cited by
-
Fibroblasts and myofibroblasts in renal fibrosis.Int J Exp Pathol. 2011 Jun;92(3):158-67. doi: 10.1111/j.1365-2613.2011.00764.x. Epub 2011 Feb 28. Int J Exp Pathol. 2011. PMID: 21355940 Free PMC article. Review.
-
Hyaluronan induces the selective accumulation of matrix- and cell-associated proteoglycans by mesangial cells.Am J Pathol. 2007 Dec;171(6):1811-21. doi: 10.2353/ajpath.2007.070085. Epub 2007 Nov 1. Am J Pathol. 2007. PMID: 17974600 Free PMC article.
References
-
- Badid C, Mounier N, Costa AM, Desmouliere A: Role of myofibroblasts during normal tissue repair and excessive scarring: interest of their assessment in nephropathies. Histol Histopathol 2000, 15:269-280 - PubMed
-
- Badid C, Vincent M, Fouque D, Laville M, Desmouliere A: Myofibroblast: a prognostic marker and target cell in progressive renal disease. Ren Fail 2001, 23:543-549 - PubMed
-
- Desmouliere A: Factors influencing myofibroblast differentiation during wound healing and fibrosis. Cell Biol Int 1995, 19:471-476 - PubMed
-
- Desmouliere A, Gabbiani G: Myofibroblast differentiation during fibrosis. Exp Nephrol 1995, 3:134-139 - PubMed
-
- Desmouliere A, Tuchweber B, Gabbiani G: Role of the myofibroblast differentiation during liver fibrosis. J Hepatol 1995, 22:61-64 - PubMed
Publication types
MeSH terms
Substances
LinkOut - more resources
Full Text Sources
Other Literature Sources

