. 2003 Feb;138(4):564-73.
doi: 10.1038/sj.bjp.0705049.

Inhibition of intestinal dipeptide transport by the neuropeptide VIP is an anti-absorptive effect via the VPAC1 receptor in a human enterocyte-like cell line (Caco-2)

Affiliations

Inhibition of intestinal dipeptide transport by the neuropeptide VIP is an anti-absorptive effect via the VPAC1 receptor in a human enterocyte-like cell line (Caco-2)

Catriona M H Anderson et al. Br J Pharmacol. 2003 Feb.

Abstract

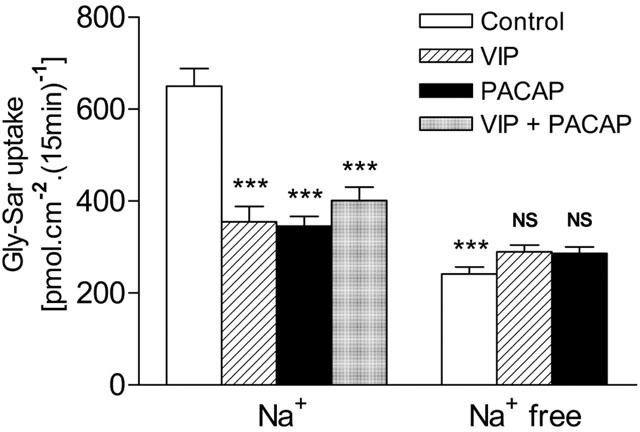
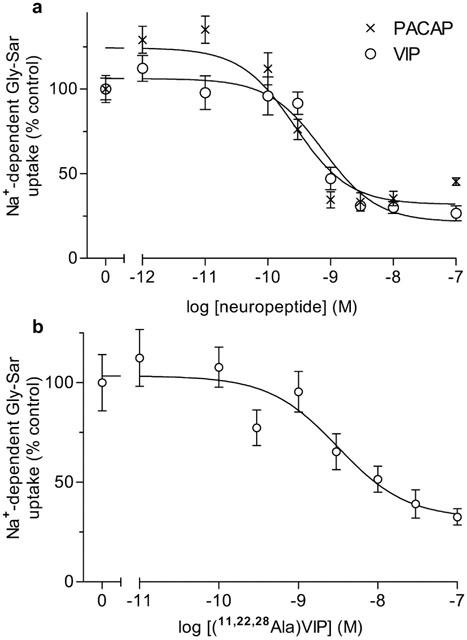
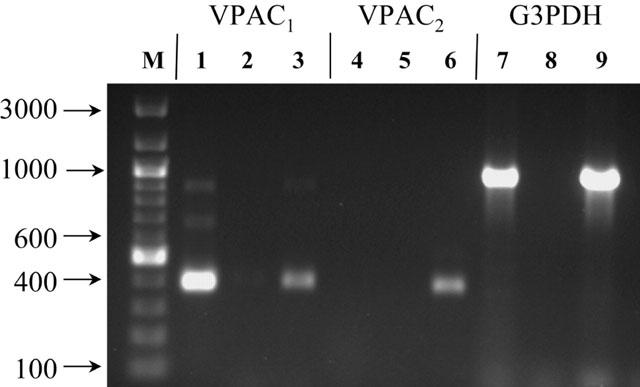
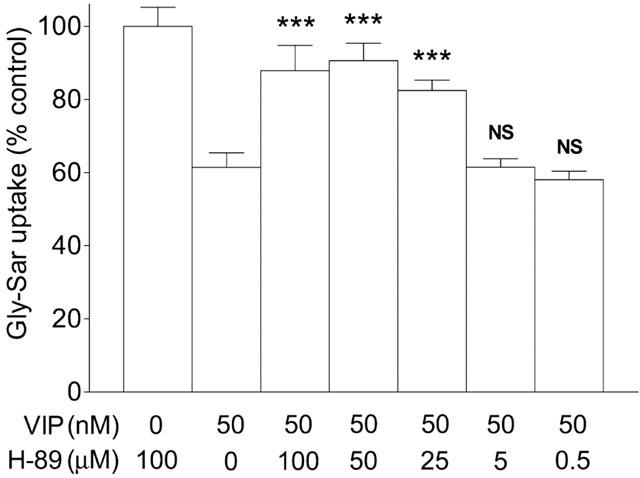
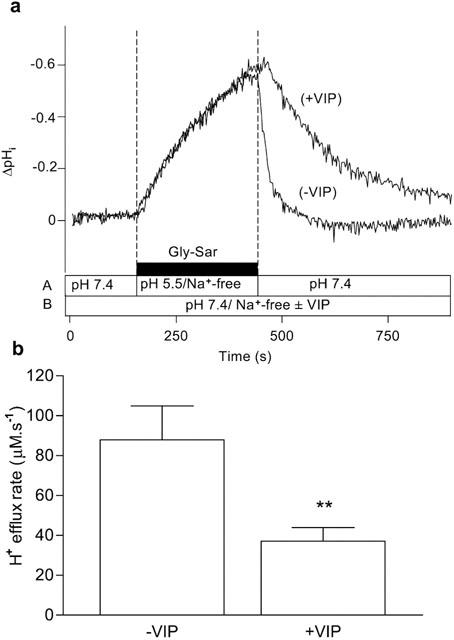
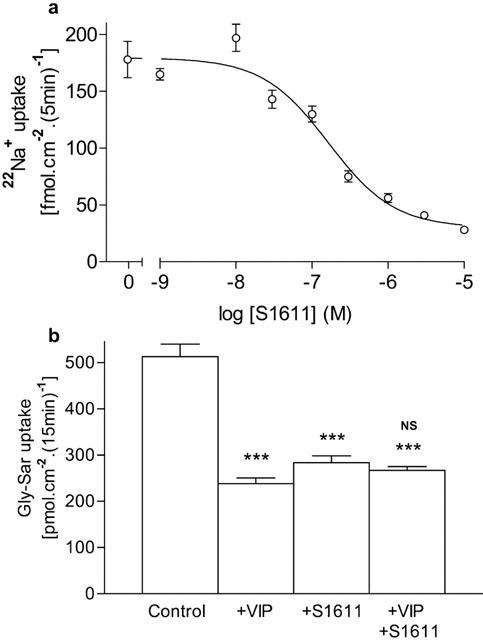
1. Optimal dipeptide and peptidomimetic drug transport across the intestinal mucosal surface is dependent upon the co-operative functional activity of the di/tripeptide transporter hPepT1 and the Na(+)/H(+) exchanger NHE3. The ability of the anti-absorptive enteric neuropeptide VIP (vasoactive intestinal peptide) to modulate dipeptide uptake was determined using human intestinal (Caco-2) epithelial cell monolayers. 2. Uptake of glycylsarcosine (Gly-Sar) across the apical membrane of Caco-2 cell monolayers is inhibited by basolateral exposure to either VIP, pituitary adenylate cyclase-activating polypeptide (PACAP), or the VPAC(1) receptor agonist [(11,22,28)Ala]-VIP. Inhibition of Gly-Sar uptake is observed only in the presence of extracellular Na(+). Reverse-transcription polymerase chain reaction (RT-PCR) demonstrates that VPAC(1) mRNA is expressed in Caco-2 cells whereas VPAC(2) mRNA is not detected. 3. The VIP-induced inhibition of Gly-Sar uptake is abolished in the presence of the protein kinase A (PKA) inhibitor H-89 (N-[2-(p-bromocinnamylamino)ethyl]-5-isoquinolinesulfonamide.2HCl). 4. (22)Na(+) uptake across the apical membrane is inhibited by the selective NHE3 inhibitor S1611. Experiments with BCECF [2',7'-bis(2-carboxyethyl)-5(6)-carboxyfluorescein]-loaded Caco-2 cells demonstrate that VIP reduces the NHE3-dependent recovery of intracellular pH (pH(i)) after dipeptide-induced acidification. Western blot of Caco-2 cell protein demonstrates expression of the NHE regulatory factor NHERF1 (expression of which is thought to be required for PKA-mediated inhibition of NHE3). 5. VIP has no effect on Gly-Sar uptake in the presence of S1611 suggesting that VIP and S1611 both modulate dipeptide uptake via the same mechanism. 6. These observations demonstrate that VIP (and PACAP) modulate activity of the H(+)/dipeptide transporter hPepT1 in a Na(+)-dependent manner consistent with the modulation being indirect through inhibition of NHE3.


Figures

Figure 1
Figure 1
Inhibition of Gly-Sar uptake (100 μM) across the apical membrane of Caco-2 cell monolayers by vasoactive intestinal peptide (VIP, 5 nM) and pituitary adenylate cyclase activating polypeptide 1-27 (PACAP, 100 nM) in the presence (Na+) but not in the absence (Na+ free) of extracellular Na+. Apical uptake was measured for 15 min at apical pH 6.5 (basolateral pH 7.4) in the presence of VIP and PACAP in the basolateral solution only. Data are mean±s.e.mean (n=6). ***, P<0.001 vs control in the presence of Na+. NS, P>0.05 vs control in the absence of Na+.
Figure 2
Figure 2
Concentration-response curves for the effect of the neuropeptides PACAP and VIP, and the VPAC1-receptor selective agonist [11,22,28Ala]-VIP on Na+-dependent Gly-Sar uptake. (a) Top panel: Gly-Sar (100 μM) uptake (15 min) was measured across the apical membrane of Caco-2 cell monolayers in the presence or absence of basolateral VIP (open circles) or PACAP (X) (both 10−7–10−12 M) in the presence of extracellular Na+. The results are expressed as the percentage uptake under control (in the absence of either VIP or PACAP) conditions (after subtraction of the uptake in Na+ free conditions). Best-fit concentration response curves were fitted using GraphPad Prism version 3.00 (r2= 0.996 for VIP; r2=0.994 for PACAP). Data are mean±s.e.mean (n=6–18). (b) Bottom panel: Gly-Sar (100 μM) uptake (15 min) was measured across the apical membrane of Caco-2 cell monolayers in the presence or absence of basolateral [11,22,28Ala]-VIP (10−7–10−11 M) in the presence of extracellular Na+. The results are expressed as the percentage uptake under control (in the absence of [11,22,28Ala]-VIP) conditions (after subtraction of the uptake in Na+ free conditions). The best-fit concentration response curve was fitted using GraphPad Prism version 3.00 (r2=0.912). Data are mean±s.e.mean (n=10–16).
Figure 3
Figure 3
Products of PCR on Caco-2 cDNA (lanes 1, 4 and 7) using primers specific for VPAC1 (lane 1), VPAC2 (lane 4) and G3PDH (control, lane 7). Negative control reactions in the absence of template DNA are shown in lane 2 (VPAC1), lane 5 (VPAC2) and lane 8 (G3PDH). As a positive control for primer competence, products of PCR on human brain (whole) cDNA using primers specific for VPAC1 (lane 3), VPAC2 (lane 6) and G3PDH (lane 9) are shown. Lane M shows DNA markers with sizes indicated. Products were separated on a 1% agarose gel and stained with ethidium bromide. Primer sequences and thermal cycling parameters are given in Methods.
Figure 4
Figure 4
The concentration-dependent protective effect of the PKA inhibitor H-89 on the VIP-induced inhibition of Gly-Sar uptake. Caco-2 cell monolayers were preincubated (apical pH 7.4, basolateral pH 7.4) with H-89 (0–100 μM, in both apical and basolateral solutions) for 60 min prior to the measurement of dipeptide uptake and throughout the 15 min uptake period. Apical Gly-Sar (100 μM) uptake was measured for 15 min (apical pH 7.4, basolateral pH 7.4) in the presence or absence of basolateral VIP (50 nM). Results are expressed as a percentage of the uptake measured in ‘control' cells which are those preincubated in the presence of 100 μM H-89 but where uptake was determined in the absence of VIP. Data are mean±s.e.mean (n=6). ***, P<0.001 vs VIP only (0 μM H-89). NS, P>0.05 vs VIP only (0 μM H-89).
Figure 5
Figure 5
Intracellular pH recovery from a Gly-Sar-induced acidification in the presence and absence of VIP. Caco-2 cell monolayers were exposed to Gly-Sar (20 mM) in the apical superfusate (apical pH 5.5, Na+-free solution) for 5 min (the basolateral membrane was superfused with a Na+-free Krebs' solution (pH 7.4) throughout the experiment). The apical superfusate was then replaced with a pH 7.4, Na+- containing, Gly-Sar-free solution and pHi recovered to basal levels. This ‘control' manoeuvre was performed in the absence of VIP (−VIP). After the ‘control' (−VIP) manoeuvre was completed the cell monolayer was exposed to VIP (5 nM) for 10 min at the basolateral membrane before the manoeuvre (acidification for 5 min with Gly-Sar followed by recovery at pH 7.4/Na+) was repeated in the presence of 5 nM basolateral VIP (+VIP) (total exposure time to VIP before recovery was 15 min). (a) Top panel: The trace represents the composite response seen in a single monolayer to successive recoveries in the absence (−VIP) and presence (+VIP) of VIP. The composition and pH of the apical (A) and basolateral (B) solutions are indicated by the horizontal bars. The results are expressed as a ΔpHi. (b) Bottom panel: The H+-efflux rate was calculated in each individual monolayer from the rate of the initial 30 s of recovery (after removal from the apical chamber of the Gly-Sar/pH 5.5/Na+-free solution) both in the absence (−VIP) and presence (+VIP) of VIP (as described in Methods). Data are mean±s.e.mean (n=8). **, P<0.01.
Figure 6
Figure 6
(a) Top panel: Concentration-dependent inhibition of apical 22Na+ uptake (5 min) into Caco-2 cell monolayers by the NHE3 selective inhibitor S1611. Cells were acidified by the NH4Cl prepulseand- release manoeuvre. After acidification, apical 22Na+ influx (1 μCi ml−1, 100 nM, 5 min) was measured at apical pH 7.4 in the absence or presence of S1611 (10−5–10−9 M). The basolateral solution was Na+-free (pH 7.4) and contained 1 mM ouabain. The best-fit concentration response curve was fitted using GraphPad Prism version 3.00 (r2=0.997). Data are mean±s.e.mean (n=11–12). (b) Bottom panel: Gly-Sar uptake across the apical membrane of Caco-2 cell monolayers. Gly-Sar (100 μM) uptake (apical pH 6.5, basolateral pH 7.4) was measured in the presence of extracellular Na+ in the presence of basolateral VIP (5 nM), apical S1611 (3 μM) or both VIP and S1611. Data are mean±s.e.mean (n=11–12). ***, P<0.001 vs Control. NS, P>0.05 VIP+S1611 vs either VIP alone or S1611 alone.
Figure 7
Figure 7
Western blotting analysis of hNHERF1 protein expression in Caco-2 cells. A band of the expected size (approximately 50 kDa) is observed with both the non-purified (lane 2) and purified (lane 4) antihNHERF1 antibody. Lane 1, pre-immune serum (as control). Lane 2, non-purified anti-hNHERF1 serum. Lane 3, non-purified anti-hNHERF1 serum (after conjugation with the antigenic peptide). Lane 4, affinity-purified hNHERF1 antibody. Lane 5, affinity-purified hNHERF1 antibody (after conjugation with the antigenic peptide). Each lane was loaded with 30 μg of Caco-2 cell protein. Size markers are indicated in kDa.

Similar articles

Cited by

References

    1. BERLIOZ F., MAORET J.J., PARIS H., LABURTHE M., FARINOTTI R., ROZE C. alpha(2)-adrenergic receptors stimulate oligopeptide transport in a human intestinal cell line. J. Pharmacol. Exp. Ther. 2000;294:466–472. - PubMed
    1. BLOOM S.R., POLAK J.M., PEARSE A.G.E. Vasoactive intestinal peptide and watery diarrhoea syndrome. Lancet. 1973;2:14–16. - PubMed
    1. BRANT S.R., YUN C.H.C., DONOWITZ M., TSE C.M. Cloning, tissue distribution, and functional analysis of the human Na+/H+ exchanger isoform, NHE3. Am. J. Physiol. 1995;269:C198–C206. - PubMed
    1. BROWN D.R., MILLER R.J.Neurohormonal control of fluid and electrolyte transport in intestinal mucosa Handbook of Physiology 1991Besthesda, MD: American Physiological Society; 527–587.(section 6, Vol 4)eds. Field, M. & Frizzell, R.A. pp
    1. BUYSE M., BERLIOZ F., GUILMEAU S., TSOCAS A., VOISIN T., PERANZI G., MERLIN D., LABURTHE M., LEWIN M.J.M., ROZE C., BADO A. PepT1-mediated epithelial transport of dipeptides and cephalexin is enhanced by luminal leptin in the small intestine. J. Clin. Invest. 2001;108:1483–1494. - PMC - PubMed

MeSH terms

Substances

LinkOut - more resources