

A possible mechanism for improvement by a cognition-enhancer nefiracetam of spatial memory function and cAMP-mediated signal transduction system in sustained cerebral ischaemia in rats
- PMID: 12598418
- PMCID: PMC1573704
- DOI: 10.1038/sj.bjp.0705096
A possible mechanism for improvement by a cognition-enhancer nefiracetam of spatial memory function and cAMP-mediated signal transduction system in sustained cerebral ischaemia in rats
Abstract
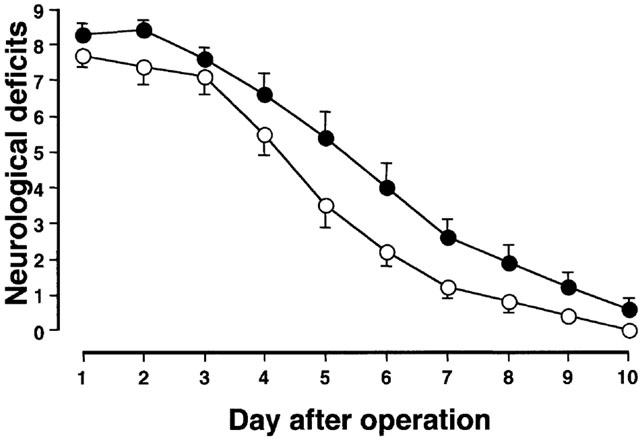
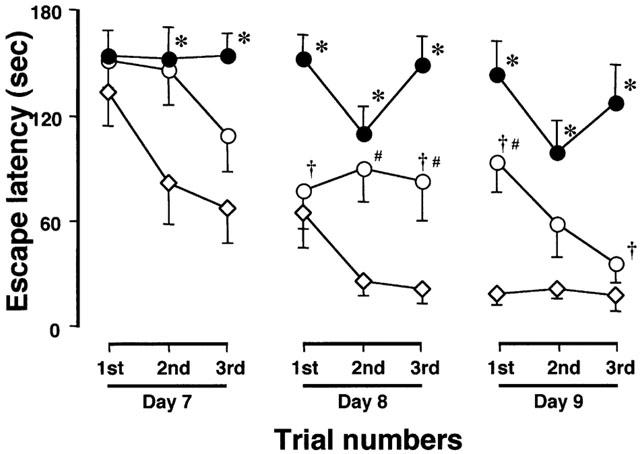
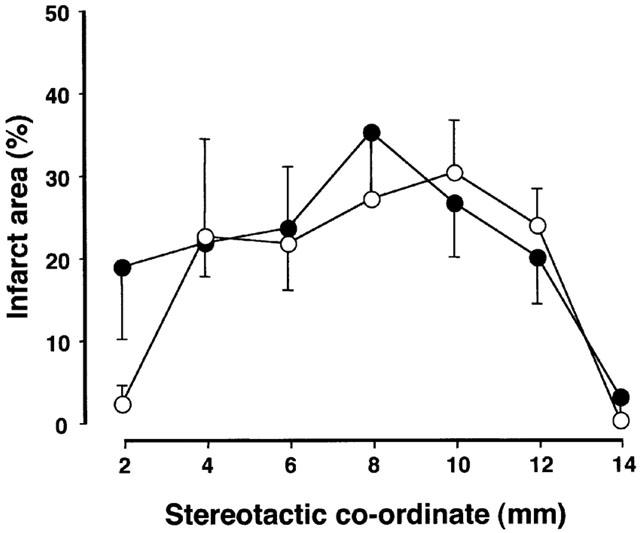
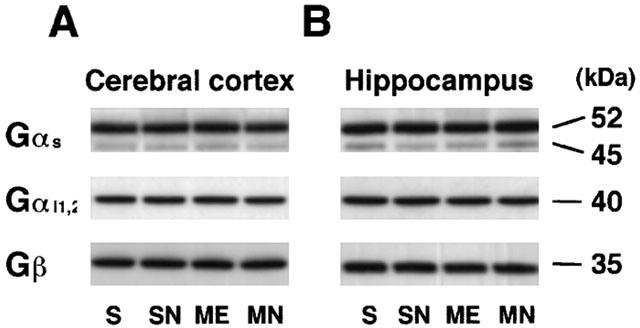
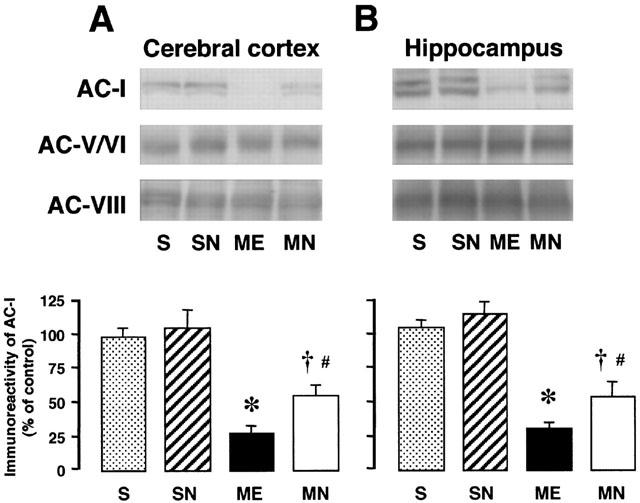
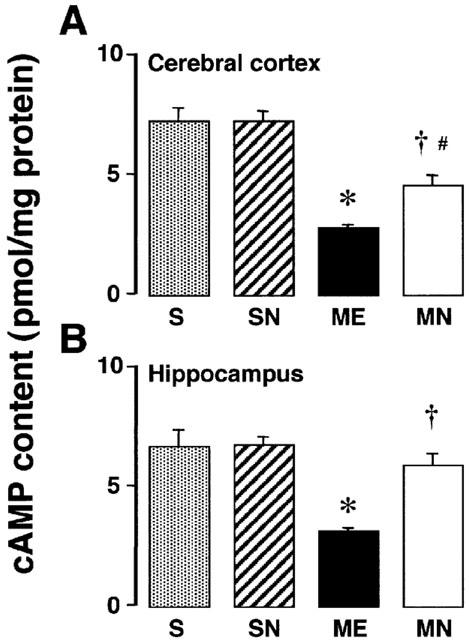
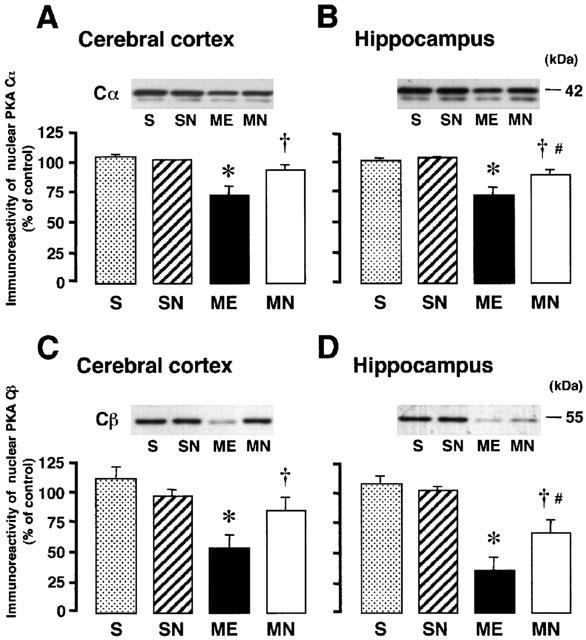
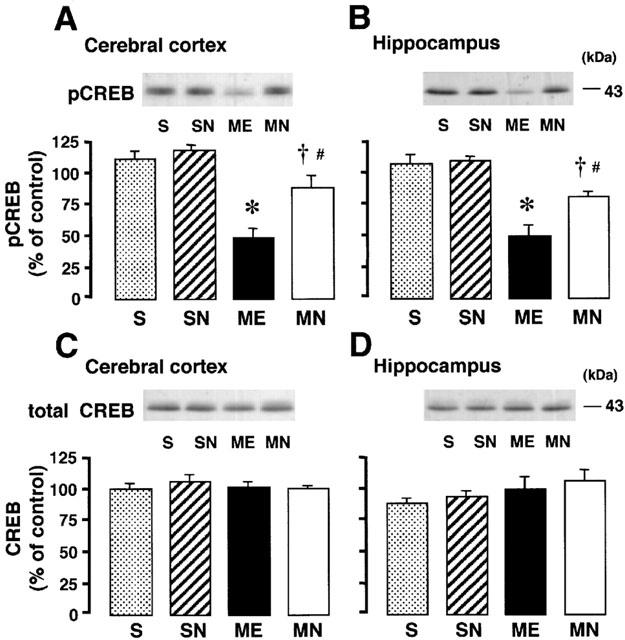
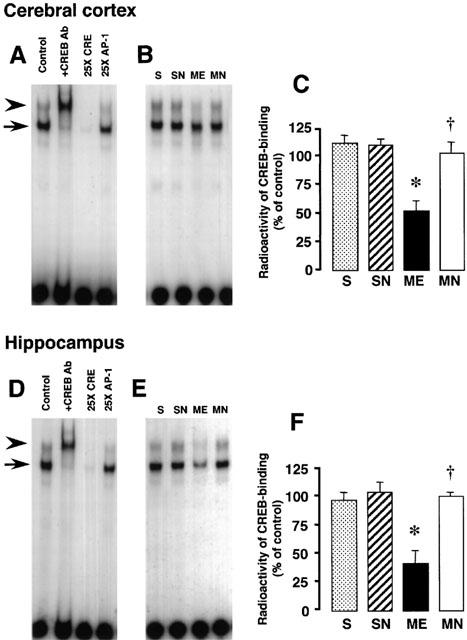
1. Accumulated evidence indicates that the adenylyl cyclase (AC)/cyclic adenosine monophosphate (cAMP)/protein kinase A (PKA)/cAMP-responsive element binding protein (CREB) signal transduction system may be linked to learning and memory function. 2. The effects of nefiracetam, which has been developed as a cognition enhancer, on spatial memory function and the AC/cAMP/PKA/CREB signal transduction system in rats with sustained cerebral ischaemia were examined. 3. Microsphere embolism (ME)-induced sustained cerebral ischaemia was produced by injection of 700 microspheres (48 micro m in diameter) into the right hemisphere of rats. Daily oral administration of nefiracetam (10 mg kg(-1) day(-1)) was started from 15 h after the operation. 4. The delayed treatment with nefiracetam attenuated the ME-induced prolongation of the escape latency in the water maze task that was examined on day 7 to 9 after ME, but it did not reduce the infarct size. 5. ME decreased Ca(2+)/calmodulin (CaM)-stimulated AC (AC-I) activity, cAMP content, cytosolic PKA Cbeta level, nuclear PKA Calpha and Cbeta levels, and reduced the phosphorylation and DNA-binding activity of CREB in the nucleus in the right parietal cortex and hippocampus on day 3 after ME. The ME-induced changes in these variables did not occur by the delayed treatment with nefiracetam. 6. These results suggest that nefiracetam preserved cognitive function, or prevented cognitive dysfunction, after sustained cerebral ischaemia and that the effect is, in part, attributable to the prevention of the ischaemia-induced impairment of the AC/cAMP/PKA/CREB signal transduction pathway.
Figures
Similar articles
-
Effects of a phosphodiesterase IV inhibitor rolipram on microsphere embolism-induced defects in memory function and cerebral cyclic AMP signal transduction system in rats.Br J Pharmacol. 2002 Apr;135(7):1783-93. doi: 10.1038/sj.bjp.0704629. Br J Pharmacol. 2002. PMID: 11934820 Free PMC article.
-
Impairment of adenylyl cyclase and of spatial memory function after microsphere embolism in rats.J Neurosci Res. 2002 May 1;68(3):363-72. doi: 10.1002/jnr.10238. J Neurosci Res. 2002. PMID: 12111867
-
Effects of nefiracetam on the levels of brain-derived neurotrophic factor and synapsin I mRNA and protein in the hippocampus of microsphere-embolized rats.Eur J Pharmacol. 2005 Jan 10;507(1-3):49-56. doi: 10.1016/j.ejphar.2004.11.033. Epub 2004 Dec 23. Eur J Pharmacol. 2005. PMID: 15659294
-
[Facilitatory actions of the cognitive enhancer nefiracetam on neuronal Ca2+ channels and nicotinic ACh receptors: their intracellular signal transduction pathways].Nihon Yakurigaku Zasshi. 1998 Oct;112 Suppl 1:41P-43P. doi: 10.1254/fpj.112.supplement_41. Nihon Yakurigaku Zasshi. 1998. PMID: 10190131 Review. Japanese.
-
Protein kinase A as a therapeutic target for memory disorders: rationale and challenges.Trends Mol Med. 2005 Mar;11(3):121-8. doi: 10.1016/j.molmed.2005.01.006. Trends Mol Med. 2005. PMID: 15760770 Review.
Cited by
-
Neuroprotective effects of roflumilast against quinolinic acid-induced rat model of Huntington's disease through inhibition of NF-κB mediated neuroinflammatory markers and activation of cAMP/CREB/BDNF signaling pathway.Inflammopharmacology. 2021 Apr;29(2):499-511. doi: 10.1007/s10787-020-00787-3. Epub 2021 Jan 31. Inflammopharmacology. 2021. PMID: 33517508
-
Opposing needling promotes behavior recovery and exerts neuroprotection via the cAMP/PKA/CREB signal transduction pathway in transient MCAO rats.Mol Med Rep. 2016 Mar;13(3):2060-70. doi: 10.3892/mmr.2016.4773. Epub 2016 Jan 13. Mol Med Rep. 2016. PMID: 26780954 Free PMC article.
-
Understanding PDE4's function in Alzheimer's disease; a target for novel therapeutic approaches.Biochem Soc Trans. 2019 Oct 31;47(5):1557-1565. doi: 10.1042/BST20190763. Biochem Soc Trans. 2019. PMID: 31642904 Free PMC article. Review.
-
The Effects of Intraoperative Hypothermia on Postoperative Cognitive Function in the Rat Hippocampus and Its Possible Mechanisms.Brain Sci. 2022 Jan 12;12(1):96. doi: 10.3390/brainsci12010096. Brain Sci. 2022. PMID: 35053838 Free PMC article.
-
Electroacupuncture Ameliorates Learning and Memory via Activation of the CREB Signaling Pathway in the Hippocampus to Attenuate Apoptosis after Cerebral Hypoperfusion.Evid Based Complement Alternat Med. 2013;2013:156489. doi: 10.1155/2013/156489. Epub 2013 Oct 20. Evid Based Complement Alternat Med. 2013. PMID: 24228057 Free PMC article.
References
-
- BERNABEU R., BEVILAQUA L., ARDENGHI P., BROMBERG E., SCHMITZ P., BIANCHIN M., IZQUIERDO I., MEDINA J.H. Improvement of hippocampal cAMP/cAMP-dependent protein kinase signaling pathways in a late memory consolidation phase of aversively motivated learning in rats. Proc. Natl. Acad. Sci. U.S.A. 1997;94:7041–7046. - PMC - PubMed
-
- BOURTCHULADZE R., FRENGUELLI B., BLENDY J., CIOFFI D., SCHUTZ G., SILVA A.J. Deficient long-term memory in mice with a targeted mutation of the cAMP-responsive element-binding protein. Cell. 1994;79:59–68. - PubMed
-
- BRADFORD M.M. A rapid and sensitive method for the quantitation of microgram quantities of protein utilizing the principle of protein-dye binding. Anal. Biochem. 1976;72:248–254. - PubMed
-
- CALI J.J., ZWAAGSTRA J.C., MONS N., COOPER D.M.F., KRUPINSKI J. Type VIII adenylyl cyclase; a Ca2+/calmodulin-stimulated enzyme expressed in discrete regions of rat brain. J. Biol. Chem. 1994;269:12190–12195. - PubMed
-
- CHUTE D.L., VILLIGER J.W., KIRTON N.F. Testing cyclic AMP mediation of memory: reversal of alpha-methyl-p-tyrosine-induced amnesia. Psychopharmacology. 1981;74:129–131. - PubMed
MeSH terms
Substances
LinkOut - more resources
Full Text Sources
Other Literature Sources
Medical
Miscellaneous
